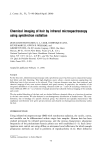
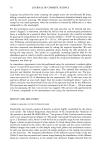
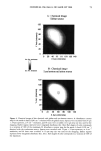
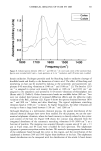
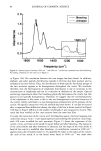
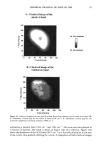
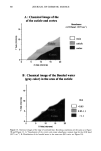
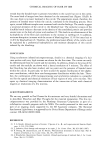
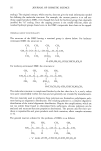
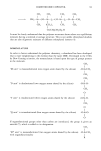
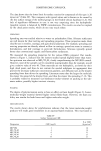
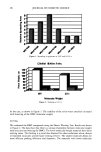
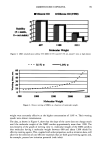
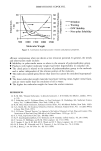
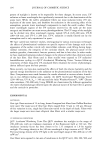
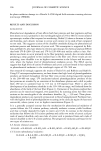
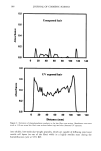
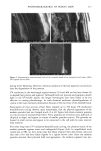
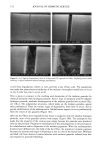
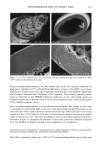
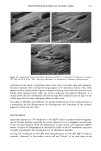
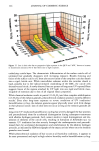
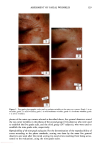
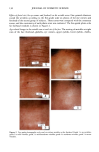
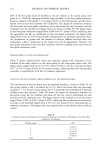
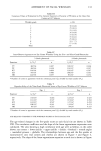
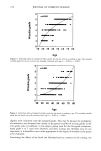
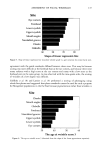
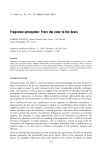
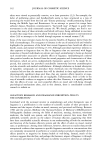
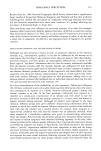
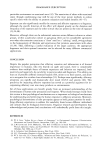
84 JOURNAL OF COSMETIC SCIENCE 2.0 1.5 o.5 0.0 • Bleaching ............ U ntrea ted I q40 cm '1 I • I • I • I • I 1800 1600 1400 1200 1000 Frequency (cm Figure 9. Infrared spectra between 1850 cm • and 900 cm -• of the hair untreated and after bleaching. Recording conditions are the same as in Figure 2. in Figure 10A. No correlation between the two images has been found. In addition, aliphatic and other peptide distributions (amides I, II) have also been studied, and no correlation has been found. Thus, the distribution of those specific functional groups of the hair structure appears to be homogeneous throughout the cortex. We conclude, therefore, that the heterogeneity of sulphonate distribution is due to variations in the concentration of sulphonate and not to a variation of thickness of the sample. Optical microscopy experiments show that bleaching physically deteriorates the cuticle, but this process is not spatially homogeneous. Therefore, we suggest that the non-homogeneity of the sulphonate in the cortex is due to the non-homogeneous structural alteration of the cuticle, which could lead to a non-homogeneous enhancement of the porosity of the cuticle. No specific interaction with the medulla has been shown. It can also be noticed that, as expected from diffraction theory, the edge of the hair is better resolved in Figure 10A than in Figure 10B due to the smaller wavelength (3 pm compared to 10 pm). This result has been verified on five cross sections from the same hair fiber. To study the interaction of the cuticle with the bleaching agent, chemical mapping was carried out using a 3-prn x 3-pm square aperture and rastering the sample at 2-pm steps, with 128 scans co-added for each spectrum. Figure 11 shows the signatures of the cuticle, cortex, and resin in the amide A region before and after bleaching. The signature of the cortex before and after treatment is identical, but the shape of the wide amide A band of the cuticle is modified after bleaching. A contribution centered at 3400 cm -• appears and is due to bonded water (1). To quantify the water in the region of the cuticle, the ratio of the amide A to the broad water band at 3400 cm -• was made after

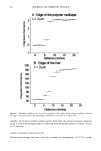
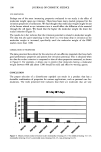
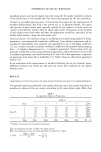
CHEMICAL IMAGING OF HAIR BY IMS 85 A: Chemical Image of the amide A band 120 100 • 8O • 40 2O 0 20 40 60 80 100 120 X Axis (microns) lnt. Abs. maximum :. •.-• Int. Abs minimum B: Chemical image of the sulnhonate band 120 100 -- . _ ... .-. 8O T= 60 • 40 2O 0 ! o do 8o X Axis (microns) Figure 10. Chemical images of the hair after bleaching. Recording conditions are the same as in Figure 4B. A: Absorbance contour map for the amide A band (3290 cm-•). B: Absorbance contour map for the symmetric sulphonate stretching vibration (1040 cm-•). subtracting a baseline from 3702 cm -• and 3102 cm -•. This ratio was then plotted as a function of position. The result is shown in Figure 12B. As a reference, Figure 12A shows the absorbance of the vCH band (2875 cm -•) as a function of position in the area of the cuticle, thus spatially defining the cuticle. A comparison of both chemical images
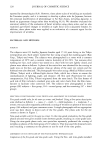
Purchased for the exclusive use of nofirst nolast (unknown)
From: SCC Media Library & Resource Center (library.scconline.org)