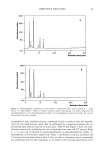
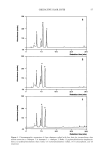
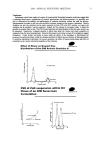
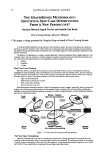
PHASE TRANSITIONS OF SEBUM 39 ation) can lead to deviations resulting in an increase or a decrease in the melting point. A decrease in transition temperature or the heat of transition therefore indicates misci- bility of the vehicle in a given sebum component. For our study, we investigated the effect on the transition temperatures of Mp-3 and Mp-4. We also documented the effect on the heat of transition associated with these transitions. However, the results of those were too variable and have not been reported here. The effect of vehicle on Mp-3 and Mp-4 transitions of model sebum (control) is plotted in Figures 3 and 4, respectively. In order to see if the vehicles, which affect Mp-3, also affect Mp-4, we plotted them against each other. As seen in Figure 5, there is little or no correlation between the two quantities. This would be logical since Mp-3 is the transition for the wax ester, whereas Mp-4 is a combination peak for the wax fatty acid and triglyceride. If a vehicle interacts with one component of the model sebum, it is not necessary that it will also interact with the other component. In general, we can see from Figure 3 that the hydrophobic materials (e.g., isopropyl myristate, maleated soyabean oil) are more effective in lowering Mp-3, while the polar materials are not as effective. This can be in part because sebum is made up of a mixture of non-polar lipids. Similarly, another set of vehicles, which are miscible with the triglyceride and fatty acid fraction of sebum (represented by Mp-4 transition), is seen in Figure 4. On examining the data (Figures 3 and 4) closely, it is seen that some of the vehicles, such as IPM (7), OA (8), transutol (9), and DMI (10), show miscibility with sebum and are also good skin permeation enhancers, while some such as glycolic acid 45 43 42 39 38 37 36 Figure 3. Effect of different vehicles on Mp-3 peak transition. Error bars indicate the standard error of the mean of three replicates. *Statistically significant at the 95% confidence level, two-tailed t-test.

40 JOURNAL OF COSMETIC SCIENCE 56 54 52 •-, 50 48 46 42 Figure 4. Effect of different vehicles on Mp-4 peak transition. Error bars indicate the standard error of the mean of three replicates. *Statistically significant at the 95% confidence level, two-tailed t-test. 42 41 40 --- 39 • 38 37 36 30 y = 0.3856x + 21.151 R 2 =0.3811 * J ( i r 35 40 45 50 Mp-4 (øC) Figure 5. Correlation between Mp-3 and Mp-4. 55
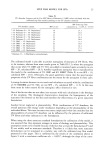
Purchased for the exclusive use of nofirst nolast (unknown)
From: SCC Media Library & Resource Center (library.scconline.org)