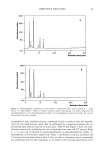
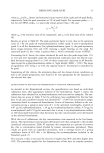
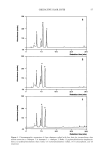
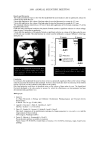
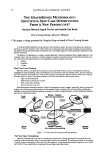
74 JOURNAL OF COSMETIC SCIENCE OPTIMIZATION OF FORMULA ATTRIBUTE USING OBJECTIVE MEASUREMENT Di Qu, Ph.D., John V. Scimeca and Louise M. Schneider Access Business Group, Ada, M149355 INTRODUCTION The perception of tackiness of a cosmetic product is an important formula attribute to the consumers. Usually, this attribute is assessed by subjective means in the lab during formula development and validated by consumer testing in the field. Results are often interpreted with a large margin of variation, which may mislead formula optimization. Bulk material tackiness has been measured objectively in food and pharmaceutical industry, and surface tackiness measurement has been seen on adhesive products. An instrumental method is desired in cosmetic industry. In this investigation, a technique is developed to assess film tackiness on skin using a texture analyzer. The method is based on tensile force measurements using a cylindrical probe. Data for method validation is presented. Film tackiness of various raw materials and typical cosmetic products are measured and presented in a scale relative to glycerin. Tackiness profiles are obtained when the measurement is repeated over a given time interval. These profiles provide dynamic insights to formula and material attributes. The results of the instrumental method and subjective evaluation are compared. Prediction of formula attributes is attempted by using a simplified model system. The potential application of this method to cosmetics formulation is discussed. MATERIALS, EQUIPMENT AND METHODS Various commercially available cosmetic ingredients, such as oils, humectants, surfactants, and rheoiogical modifiers, as well as some consumer products, were tested in this study. A texture analyzer (TA-XT2, Texture Technology Corp.) was employed to measure film tackiness. A probe, with a smooth and curved surface for good skin contact, was made in-house using plastic material. A test is typically conducted by the following procedures: a) apply 0.2 ml test material on a specified skin site of a human subject and rub for l0 circles b) place the forearm on the platform of the texture analyzer and c) activate the probe to press against the skin and then withdraw. Force responses to the probe movement are recorded and the maximum tensile is calculated. RESULTS AND DISCUSSIONS A. Method Development : Force responses from tackiness measurements are shown in Figure I. Force increases to a maximum when the probe is pressed against the skin. It then decreases to zero when the probe withdraws from the skin, as shown by the curve for the dry skin. Ifa material is tacky the measured force will fall into the negative region to form a valley in the 1 - 1.5 second time interval, as indicated by the curve for glycerin. Tackiness is expressed as maximum tensile in the unit ofg/cm 2. The deeper the valley, the tackler the material. Figure 1. Force Responses from Tackiness Measurements 48O- .,-- // I Glycerin 24O - 12o_ Time, sec Figure 2. Relative Tackiness of Various Cosmetic Ingredients !Oq• TEA -t•ur• S ul•ate • l o'/,, c•,P Hy•mx•esult•ne .... . So.urn L&ureth Sulbte 0_11• Xanlh•n Gum 5 •ut•n - ' -- 5• o•-10 5 omu•n 4% E •lsiier BMnd GideOn • • _ Head•mSeed Ol • Tacklness Scale (mla•ve • glycerin) B. Relative Tackiness Scale: Tackiness of various cosmetic ingredients were measured on skin at 0, 30 and 60 seconds after application. The highest value of the three was used to indicate material tackiness. Comparing each value with that of glycerin results in a relative tackiness scale. Figure 2 shows the scale for various cosmetic ingredients. This chart provides a numerical indication about material tackiness that can be helpful when formulating a product. C. Tackiness ProfiIe- Time Dependence: Material tackiness changes over time and therefore it is necessary to obtain a complete profile to show its time dependence. This can be done by conducting multiple measurements over a given time interval. Figure 3 shows tackiness profiles of selected materials with respect to time. Certain

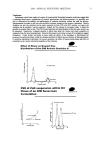
2001 ANNUAL SCIENTIFIC MEETING 75 gums and surfactants exhibit a peak one minute after application while less significant change is shown by the oil- based materials. Dry skin shows no tackiness, which serves as a baseline for this attribute. Figure 3. Tackiness Profiles of Various Cosmetic Ingredients _ . -- 0 1 2 3 4 5 6 10• TEA-Lautyl Surfate C10-30 Cholesterol E$1er$ 0 3% HPMC Gl•Cerm • Petrolalum ----• 0 3% M•-AJ Dry skin Figure 4. Tacklness Profiles of Different Makeup Removers 3 o5 , ,•V,•._•.•=• • o 0 2 4 6 Time, rain ( ,I. A/lbydrous .'- O•n-WaGelMi(3'oemulsion Emul D. Tatkiness Evaluation of Cosmetic Products: Various cosmetic products were measured for their tackiness to provide direction to optimization of formula attributes. Figure 4 shows the measured profiles of three different makeup removers after they were applied on the skin and then wiped off with tissue. A microemulsion formula exhibits high tackiness after application and maintains at a relatively high level over 5 minutes of testing. An oil- in-water emulsion formula, on the other hand, showed very low maximum tensile throughout the test. Finally, an anhydrous gel formula shows a tackiness profile between those two. If these products are designed for a tissue-off claim, the O/W emulsion is an obvious choice due to its low tackiness profile. E. Correlation between Objective and Subjective Tests: Fourteen materials in seven pairs were tested both by a panel of 80 people and by the instrumental method. The panels used a subjective scale of I -9 while the objective method used maximum tensile to assess tackiness. After normalizing the data ranges to be comparable with each other, a correlation between the two results was obtained as shown by Figure 5. It is seen that two tests correlated very well in regard to the trends of tackiness assessment. Comparing to the diagonal line which indicates a perfect correlation, the change in slope of the test data shows the system error and indicates the difference between the two independent systems. Results had shown that more accurate evaluation of tackiness Figure 5. Data Correlation (t=0 sec, normalized) 8 R2 = 0.899S' ø'1' I •'.:' I Perfect 0 02 04 06 08 Tackiness by Instrument Figure 6. Optimizing Formula Attribute 0 I 2 3 4 5 Time, rain was obtained using the objective measurement based on statistical analysis of the test data. Glycerin Glycereth-26 Butylene Glycol Water F. Formula Optimization Using a Model System: An oil-in-water emulsion was used as a model system to optimize formula attribute based on raw material tackiness values. Water and three humectants (glycereth-26, glycerin, and butylene glycol) were used at 6% in each variation. Although individual tackiness was minimized in a complete formula highest tackiness was observed in the formula containing 6% glycerin, which agreed with its tackiness property very well (Figure 6). Similar trends were observed for other ingredients such as gums and oils. CONCLUSIONS An objective measurement of tackiness was adequately defined and developed in this study by using the texture analyzer. Quantitative results were obtained. Good correlation was shown when compared with the subjective results using panel test. Use of this method would save time and effort in providing quick formula direction by measuring tackiness of benchmark and prototype products. REFERENCES I. TA-XT2 Texture Analyzer User Guide. Texture Technologies Corp. 2. Aboubacar, A. & Hamaker, B. R. (2000). Journal of Cereal Science, 31 (2), 119-126. 3. Jones, D. S. & Woolfson, A.D. (1997). Pharmaceutical Manufacturing Review, 9 (1). 4. Johnson, M (1996). Adhesives & Sealants Industry, October/November, pp 40-43.
Purchased for the exclusive use of nofirst nolast (unknown)
From: SCC Media Library & Resource Center (library.scconline.org)