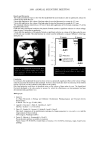
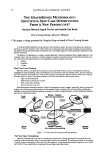
62 JOURNAL OF COSMETIC SCIENCE THE BEAUTY IMAGING SYSTEM: FOR THE OBJECTIVE EVALUATION OF SKIN CONDITION Kukizo Miyamoto and Greg G. Hillebrand, Ph.D. The Procter & Gamble Company INTRODUCTION: Consumers want skin care products that target their personal skin care needs. Professional medical personnel need to be able to track changes in skin condmon as a result of various skin treatments. D•gital imaging offers a fast, accurate and objective means to evaluate and track changes in skin condition over time. We have developed a unique •mage analysis tool called the Beauty Imaging System (BIS) for measuring the most common facial skin problems. Results are conveyed in a meaningful way that both scientists and non-scientists can understand and use. The system employs conventional high resolution digital cameras for capturing facial •mages under both normal and long wave length UVA illumination combined with sophisticated image analysis software for identifying and quantifying facial wrinkles, texture, pores and hyperpigmented spots. Drawing on a vast store of images collected from around the world, a person's image analysis results are expressed as a percentfie for her age and ethnic background. The Beauty Imaging System has several utilities including skin consultation, clinical studies, monitoring the progress of skin treatments m a professional setting and image archiving. SYSTEM DESCRIPTION: The Beauty Imaging System is shown m Fig. 1. The •maging booth was designed to be free from ambient light and can provide two types of illuminanon for measurement of visible and invisible information. The client's head is positioned in the booth with the aid or chin and forehead rests. An image is captured of either the left or right side of the face. A 1.3 mesa pixel CCD digital camera eqmpped with a close-up lens •s mounted in the imaging booth and the collected images are digitally transformed and saved to the computer. These collected images are then analysed to quantify the skin features by the set of image analysis programs. Each measured skin feature can be then compared with the average for the person's age and ethnic group and expressed as a percentile. The captured images and image analysis data are stored in the computer hardware, for subsequent tracking of changes in skin con&tion. All the system operation •s controlled by the user friendly software program. IMAGE ACQUISITION: System illuminanon and the camera can be cahbrated by a white-balancing program to adjust the target brightness values by using a GretagMacbeth neutral 8.0 gray color board accurately positioned in front of the camera. We equipped a fixed- position chin rest and forehead rest in the booth for accurate posmomng of the face. Once the subject's head is positioned within the imaging system, two facial images ofe•ther the left or right side are captured under normal and UV-fiuorescent illumination. For measurement of changes in facial skin condition during a course of the treatment, a baseline image is taken at the first visit and •s used for subsequent images to accurately reposition the subject's head. SubJects should be evaluated at approximately the same nine of the day during the course of the study to prevent any influence of diurnal vananon affecting the skin condinon. Factal image byNormal dhtmtnatton 6500øK high frequency fluorescent white light sources were mounted on the top and on the sideof the booth providing even illumination while enhancing skin topographical reformanon (e.g., wrinkles and texture) in the facial images. This mmge •s used for the measurement of facial wrinkles, texture, pores and hypcrpigmented spots as one would observe under normal ambient lighting condmons. Facial rotage b)' UV- fittoresce,t dhmtmation Two strobe lights were mounted on the left and right s•des of the •mag•ng booth. The strobes were eqmpped with glass band pass filters whmh can allow transmission of onb, long wavelength UVA t, 350-400nm, peak range of 370nm). This UV- fluorescent •mage is used for the visuahzation and measuremcnt of 1) famal hyperp•gmentation not visible under normal white light illumination 2) bacterially-produced porphyrins m the skin pores which can not be perceived under normal white light illumination. These two parameters measured by UV-fluorescent images were compared w•th visible hyperpigmented spots and pores measured by fluorescent images. QUANTIFICATION OF SKIN INFORMATION A: Normal fluorescent •mage Image is masked for the region of eye around area and cheek and four key parameters were measured by the •mage analysis programs as following parameters: 1: Total wrinkle area/masking area = wrinkle area fraction 2: Total texture area/masking area = texture area fraction 3: Total pore count/masking area = pore count fraction 4: Total visible hyperp•gmented spot count/mask area = spot count fraction B: Diagnose of skin condition Using BIS, we have collected facial images of 3160 healthy females who are Caucasians, Asians, Indians, H•spanics and African Americans living m rather the US, Europe and Japan from age 10 to 65 years. These •mages were analyeed by BIS and statisncal models were developed for the age dependent changes •n each of the skin features of interest (wrinkles, texture, pores and spots) for each racial group. Using these models, a individual's BIS results can be compared to the average for her

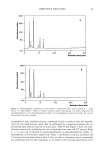
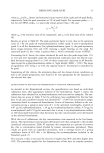
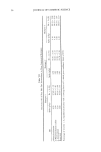
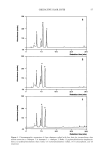
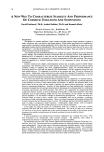
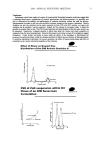
2001 ANNUAL SCIENTIFIC MEETING 63 age and ethnic group yielding a percentile, or "BIS Score" (Fig.2). In this way, IA data are expressed in a more meaningful way to the BIS client. C: UV-fluorescent image Image is masked as the same way and 2 parameters were measured by the image analysis as following parameters: 1: Total number of visible/invisible hyperpigmented spots 2: Total number pores containing porphyrm D: Comparison of"visible" (by normal image) and "invisible" (by UV fluorescent image) information by the image analysis. 1) Percent of invisible hyperpigmentation on the face. = Total spot count fraction on ((UV-fluorescent image)-(normal image)) x 100 Total spot count on (UV-fluorescent image) 2) Percent of pores having porphyrin on the face. = (Total number ofporphyrin on UV-fluorescent image) x 100 (Total number of pores on normal •mage) Comparison of data and images under visible and invisible information are shown in Fig. 3. SYSTEM VALIDATION: System reproducibility and accuracy for the measurement of facial wrinkles, texture , pores and hyperpigmented spots under normal image. The intra-subject coefficient of variation (COV) of wrinkle area fraction, texture area fraction, pore area fraction and spot area fraction for five images of the same subject (images spaced 10 min. apart) were determined over five subjects. The within subject COVs for wrinkle, texture, pores and spots measurements in the cheek and eye area were 5.2%, 4.6%, 3.4%, 2.9%, respectively. Accuracy of wrinkle and spot measurement was determined using mannequin heads to which circular artificial spots of known area and artificial wrinkles of known length and width were applied the computer image analysis measured area was compared to the true area. The imaging system accuracy for measurement of hyperpigmented spot area and wrinkle area was determined to be less than +/-5% when measurements were made in the region of the cheek and eye area. All image analysis measurements of live subjects were confined to the area of the cheek and around the eye. Correlation between BIS measured skin parameters with visual perception. Images from a total of 383 Japanese subjects were collected and analyzed with BIS for their facial wrinkle area fraction, texture area fraction, pore count fraction and spot count fraction. These images were also visually graded on the computer monitor by 5 judges for the severity of these four skin parameters using the following grading scale: 1: None Score 0 2: Slight Score 25 3: Moderate Score 50 4: Severe Score 75 5: Very severe Score 100 The correlation coefficient between measured skin parameters and mean visual grading score by judges was analysed for each parameter. Pearson's correlation coefficients (r) of wrinkle, texture, pores and hyperpigmented spots for the correlation of BIS image analysis with visual grading were 0.886, 0.811, 0.895, 0.875, respectively. The regression line equations were: (Wrinkle area fraction) = 0.0022 (visual grading of texture) + 0.0251 (Fig. 4) (Texture area fraction) = 0.049 (visual grading score of texture) + 0.3936 (Pore count fraction) = 0.0008 (visual grading score of pores) + 0.0015 (Spot count fraction) = 0.0004 (visual grading score of spots) + 0.0066 CONCLUSIONS AND DISCUSSION: We have developed BIS, a digital imaging system, and demonstrated its utility to quantify skin conditions by using high- resolution digital imaging technology. We confirmed by several validation studies that this system was sensitive enough to detect these parameters and offered excellent correlation with visual perception. In addition, BIS results can be expressed in a meaningful way by comparing a person's iamge analysis data to the norms for her age and ethic group. The UV-fiuorescent images allow for visualization and quantification of invisible hyperpigrnentation and porphyrins in pores for even further understanding of skin condition. REFERENCES: 1. McGinley, K.J. Webster, G.F. Leyden, J.J. British Journal ofDermatology. 1980, 102,437. 2. Rimington, C. Blochem J. 1960.75,620. 3. Polo, C. F., et al. Clin Chem. 1988.34/4,757-760. 4. N. Kollias., R. Gillies., at al., Flourescence photography in the evaluations ofhyperpigmentation in photodamaged skin, J. Am. Acad. Dermatol., 1997 36: 226-30. 5. B. Gilchrest, T. Fitzpatrick, R. Anderson, J. A. Parrish, Localization of melanin pigmentation in the skin with Wood's lamp, British J. Dermatol., 1997 96, 245-248. 6. Kang S. and Sober A.J., disturbances of Melanin Pigmentation", in Dermatology, Moschella and Hurley, Ed. Vol. 2, 3 rd Ed., pp. 1442-1474 (1992).
Purchased for the exclusive use of nofirst nolast (unknown)
From: SCC Media Library & Resource Center (library.scconline.org)