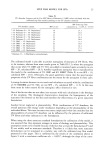
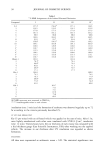
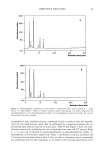
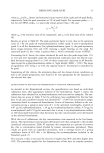
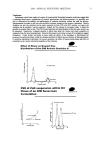
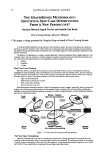
52 JOURNAL OF COSMETIC SCIENCE 1 ooc 75C- 50C - 25C- 001] 200 250 300 4•0 1 ooo I // 600 -I / o •o Figure 2. UV spectra comparison of four hair dye intermediates and a matrix compound between 200 and 400 nm. a: p-phenylenediamine reference. b: p-phenylendiamine in the analyte. c: m-phenylenediamine sulfate reference. d: m-phenylenediamine sulfate in the analyte. e: m-aminophenol reference. f: m- aminophenol in the analyte. g: resorcinol reference. h: resorcinol in the analyte. i: sodium ascorbate reference. j: sodium ascorbate in the analyte. The repeatability of the analysis was also investigated, in terms of retention times and peak areas for the four hair dyes in the five formulations. Data are gathered in Table III. On the whole, the repeatability of the separation is high for both the retention times (0.10%RSDl.24%) in the five formulations and the peak response intensity (0.21%RSD9.46%) except for this second parameter in the "light blonde" formula- tion: the RSD of peak areas in the "light blonde" formulation is somewhat higher (5.84%RSD14.35%) because of the low concentration of the hair dyes in this for- mulation. The quality of the column was also evaluated by calculating the peak asymmetry factor s and the capacity factor k' of the peaks attributed to the hair dyes according to the following formulas (b) and (c) respectively: a5va + b5v• s - (b) 2 x a5v •

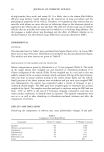
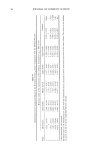
OXIDATIVE HAIR DYES 53 where as• and b5% denote the horizontal (time) interval of the right and left peak flanks, respectively, from the peak maximum at 5 % of peak height. For optimum peaks, s = 1, but for real HPLC peaks, s is practically always greater than 1 (8), and tR, - t o k' - -- (c) Zo where tRi is the retention time of the compound i and t o is the dead time of the column (8). Results are given in Table IV. The peak asymmetry factor is very close to the optimum value of 1 for the peaks of m-phenylenediamine sulfate (peak 4) and m-aminophenol (peak 5) in all five formulations. For p-phenylenediamine (peak 3), the peak asymmetry factor ranges between 0.83 and 0.96, showing a slight fronting on the peak. For resorcinol (peak 6), the s value is greater than 1, which commonly occurs in HPLC. Concerning the k' factor, the values calculated for each hair dye peak range from 1.03 to 3.03 and were repeatable under the experimental conditions used, the relative stan- dard deviation ranging from 0 to 2.0% on three consecutive injections in all formula- tions except for m-phenylenediamine sulfate in "light blonde" (RSD = 5.9%). The range of significance of k' being 1 to 5 (8), the capacity factor k' determined is considered to be good. Considering all the criteria, the stationary phase and the chosen elution conditions, as well as the sample preparation, were found to be very appropriate for the separation of the selected hair dyes. QUANTITATION OF THE HAIR DYE INTERMEDIATES IN SYNTHETIC FORMULATIONS As detailed in the Experimental section, the quantification was based on individual calibration lines, after appropriate dilution of the formulations. Figure 3 shows the calibration lines obtained for p-phenylenediamine and resorcinol as examples. The ana- lytical data are given in Table V for the calibration lines established for the four hair dyes. In all cases, excellent linearity was obtained (R 2 0.987) for concentration ranges commonly found in commercial formulations. Limits of detection, defined as the con- centration giving a signal-to-noise ratio of 3 at the optimum wavelengths, resulted in 0.87 pg for p-phenylenediamine, 1.10 pg for m-phenylenediamine sulfate, 0.70 pg for m-aminophenol, and 0.52 pg for resorcinol, that is to say 4 (m-phenylenediamine sulfate) to 160 (resorcinol) times lower than the lowest hair dye concentrations to be determined in the selected formulations. With this set of calibrations, the dye concentrations were measured in the five formu- lations. The experimental concentrations determined were then compared to the initially introduced concentrations. Table VI expresses this comparison as a percent of recovery Re, that is concentration found divided by known concentration introduced. These results are given with an expanded uncertainty, with a coverage factor of 2 giving confidence limits of 95% (Re e 2s) following the recommendations included in the Eurachem guide (7). The outcome is that in all cases the recovery is higher than 90% and often higher than 95%. The procedure applied for the determination of hair dyes in complex synthetic
Purchased for the exclusive use of nofirst nolast (unknown)
From: SCC Media Library & Resource Center (library.scconline.org)