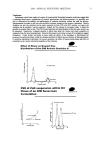
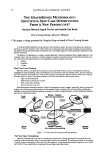
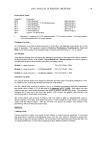
2001 ANNUAL SCIENTIFIC MEETING 63 age and ethnic group yielding a percentile, or "BIS Score" (Fig.2). In this way, IA data are expressed in a more meaningful way to the BIS client. C: UV-fluorescent image Image is masked as the same way and 2 parameters were measured by the image analysis as following parameters: 1: Total number of visible/invisible hyperpigmented spots 2: Total number pores containing porphyrm D: Comparison of"visible" (by normal image) and "invisible" (by UV fluorescent image) information by the image analysis. 1) Percent of invisible hyperpigmentation on the face. = Total spot count fraction on ((UV-fluorescent image)-(normal image)) x 100 Total spot count on (UV-fluorescent image) 2) Percent of pores having porphyrin on the face. = (Total number ofporphyrin on UV-fluorescent image) x 100 (Total number of pores on normal •mage) Comparison of data and images under visible and invisible information are shown in Fig. 3. SYSTEM VALIDATION: System reproducibility and accuracy for the measurement of facial wrinkles, texture , pores and hyperpigmented spots under normal image. The intra-subject coefficient of variation (COV) of wrinkle area fraction, texture area fraction, pore area fraction and spot area fraction for five images of the same subject (images spaced 10 min. apart) were determined over five subjects. The within subject COVs for wrinkle, texture, pores and spots measurements in the cheek and eye area were 5.2%, 4.6%, 3.4%, 2.9%, respectively. Accuracy of wrinkle and spot measurement was determined using mannequin heads to which circular artificial spots of known area and artificial wrinkles of known length and width were applied the computer image analysis measured area was compared to the true area. The imaging system accuracy for measurement of hyperpigmented spot area and wrinkle area was determined to be less than +/-5% when measurements were made in the region of the cheek and eye area. All image analysis measurements of live subjects were confined to the area of the cheek and around the eye. Correlation between BIS measured skin parameters with visual perception. Images from a total of 383 Japanese subjects were collected and analyzed with BIS for their facial wrinkle area fraction, texture area fraction, pore count fraction and spot count fraction. These images were also visually graded on the computer monitor by 5 judges for the severity of these four skin parameters using the following grading scale: 1: None Score 0 2: Slight Score 25 3: Moderate Score 50 4: Severe Score 75 5: Very severe Score 100 The correlation coefficient between measured skin parameters and mean visual grading score by judges was analysed for each parameter. Pearson's correlation coefficients (r) of wrinkle, texture, pores and hyperpigmented spots for the correlation of BIS image analysis with visual grading were 0.886, 0.811, 0.895, 0.875, respectively. The regression line equations were: (Wrinkle area fraction) = 0.0022 (visual grading of texture) + 0.0251 (Fig. 4) (Texture area fraction) = 0.049 (visual grading score of texture) + 0.3936 (Pore count fraction) = 0.0008 (visual grading score of pores) + 0.0015 (Spot count fraction) = 0.0004 (visual grading score of spots) + 0.0066 CONCLUSIONS AND DISCUSSION: We have developed BIS, a digital imaging system, and demonstrated its utility to quantify skin conditions by using high- resolution digital imaging technology. We confirmed by several validation studies that this system was sensitive enough to detect these parameters and offered excellent correlation with visual perception. In addition, BIS results can be expressed in a meaningful way by comparing a person's iamge analysis data to the norms for her age and ethic group. The UV-fiuorescent images allow for visualization and quantification of invisible hyperpigrnentation and porphyrins in pores for even further understanding of skin condition. REFERENCES: 1. McGinley, K.J. Webster, G.F. Leyden, J.J. British Journal ofDermatology. 1980, 102,437. 2. Rimington, C. Blochem J. 1960.75,620. 3. Polo, C. F., et al. Clin Chem. 1988.34/4,757-760. 4. N. Kollias., R. Gillies., at al., Flourescence photography in the evaluations ofhyperpigmentation in photodamaged skin, J. Am. Acad. Dermatol., 1997 36: 226-30. 5. B. Gilchrest, T. Fitzpatrick, R. Anderson, J. A. Parrish, Localization of melanin pigmentation in the skin with Wood's lamp, British J. Dermatol., 1997 96, 245-248. 6. Kang S. and Sober A.J., disturbances of Melanin Pigmentation", in Dermatology, Moschella and Hurley, Ed. Vol. 2, 3 rd Ed., pp. 1442-1474 (1992).

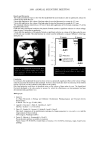
64 JOURNAL OF COSMETIC SCIENCE 7. M. Jimbow and K. Jimbow, Pigmentary Disorders •n Oriental Skin, Clinics in Dermatologo,, 7, I 1-27 ( 1989)_ 8. Caron D. et al., Split -face comparison of adapalene 0.1% gel and tretinoin 0.025% gel in acne patients. J Am Acad Dermato136 (6 Pt 2) pSI 10-2 (1997). Fig. I: BIS (Beauty Imaging System) Overview ... F•g. 2: "BIS Score" BIS results compared to the average for her age and ethnic group yielding a percentlie. • 0 10 20 30 40 50 60 70 0 10 20 30 40 50 60 70 0 10 20 30 40 50 60 70 ' •-.-. : ......... • ...... .• ,.,. -: .y..•:' 0 10 20 30 40 50 60 70 .... ,, :. ,%•
Purchased for the exclusive use of nofirst nolast (unknown)
From: SCC Media Library & Resource Center (library.scconline.org)