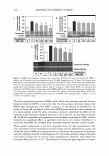
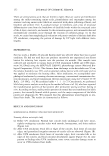
118 JOURNAL OF COSMETIC SCIENCE catalyzes the oxidation of tyrosine and dihydroxyphenylalanine (DOPA), subsequently leading to the formation of melanin (7). Skin pigmentation triggered by pathophysiological or environmental factors has a great cosmetic relevance and has prompted the screening of effective natural or chemical agents for decreasing melanogenesis (8). The potential depigmenting agents so far identified include inhibitors of tyrosinase gene expression (9, 10) and inhibitors of ty- rosinase enzyme activity (11-13). In our previous studies, 4-hydroxy-5-methyl-3[2H}- furanone (HMF) has been isolated from pine needles as an antioxidant component and has been shown to inhibit tyrosinase activity, suggesting its potential use as a depig- menting agent (14, 15 ). In an attempt to clarify the action mechanism of HMF, the present study investigates its effects on melanin formation and tyrosinase expression in the murine melanoma B16F10 cells stimulated with theophylline, an activator of cyclic AMP/protein kinase A signaling, leading to tyrosinase gene expression. It also examines if HMF affects tyros- inase-catalyzed DOPA oxidation in vitro and in situ in the cells. The results suggest that HMF may inhibit cellular melanogenesis through a dual mechanism inhibiting tyros- inase gene expression and enzyme activity of the pre-existing tyrosinase. MATERIALS AND METHODS REAGENTS HMF, arbutin, theophylline, and DOPA were purchased from Sigma-Aldrich (St. Louis, MO). Antibodies for tyrosinase and �-actin were purchased from Santa Cruz Biotech (Santa Cruz, CA) and Sigma-Aldrich, respectively. CELL CULTURE AND MELANIN MEASUREMENT Murine melanoma Bl6F10 cells (CRL-6475) were obtained from American Type Cul- ture Collection (Manassas, VA). The cells were cultured in Dulbecco's modified Eagle's medium that contained 10% fetal bovine serum, 100 U/ml penicillin, 0.1 mg/ml streptomycin, and 0.25 µg/ml amphotericin B at 3 7°C in a humidified atmosphere containing 5% CO2 and 95% air. Typically, cells cultured in 24-well culture plates were treated with HMF or arbutin at 50 ~ 400 µM for 60 minutes prior to stimulation with 1.0 mM theophylline for 72 hours. After incubation, the extracellular melanin content in the cell culture media was observed at 490 nm using a multi-well scanning spectro- photometer. Cell morphology and pigmentation were examined under an inverted-phase microscope (Eclipse TSlO0) from Nikon (Melville, NY). Cell viability was assayed using 3-[ 4, 5-dimethy l thiazol-2-y 1)-2, 5-di pheny 1 tetrazoli um bromide (MTT). PREPARATION OF CELL L YSA TES AND WESTERN BLOTTING After treatment, cells were washed twice with ice-cold PBS and yielded into a lysis buffer (10 mM Tris-Cl, pH 7.4, 120 mM NaCl, 25 mM KCl, 2 mM EGTA, 1 mM EDTA, and 0.5% Triton X-100 and protease inhibitor cocktail) in a pre-cooled tube. After 45 minutes of lysis on ice, the homogenate was centrifuged at 14,000 x g for 15 minutes

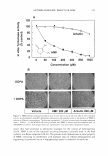
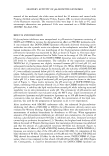
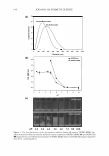
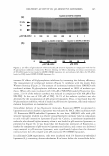
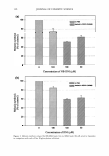
ANTIMELANOGENIC EFFECTS OF HMF 119 at 4°C to obtain clear cell lysates. Western blotting was performed as previously de- scribed (16). Aliquots of the cell lysates (20 µg protein each), diluted in a Laemmli buffer containing 2% SDS and 1.2% dithiothreitol, were heated at 95°C for five minutes to denature the proteins. The proteins were separated by electrophoresis on a 10% SDS- polyacrylamide gel at 200 V for 1.5 hours and transferred to a nitrocellulose membrane. The membrane was incubated with a primary antibody overnight at 4°C, and then with a secondary antibody conjugated with alkaline phosphatase for one hour at room tem- perature. The bands were detected using a chemiluminescence kit (Pierce, Cheshire, UK) according to the manufacturer's instruction, and were subjected to densitometry analy- sis. REVERSE TRANSCRIPTASE-POLYMERASE CHAIN REACTION (RT-PCR) ANALYSIS PCR primer sets specific for mouse tyrosinase and D-glyceraldehyde-3-phosphate de- hydrogenase (GAPDH) were designed using Primer3 software (Whitehead Institute/MT Center for Genome Research) on the basis of sequences deposited in the NCBI GenBank database. The sequences of the primers used in this study were: tyrosinase (GeneBank accession number, NM011661) 5'-ATG GGT CAA CAC CCA TGT TT-3' (sense) and 5'-GGC AAA TCC TTC CAG TGT GT-3' (antisense) and GAPDH (GeneBank ac- cession number, NM008084), 5'-TGT TCC TAC CCC CAA TGT GT-3' (sense) and 5'-TGT GAG GGA GAT GCT CAG TG-3' (antisense). Total cellular RNA was isolated using TRIZOL® Reagent (Invitrogen, Carlsbad, CA) as per the manufacturer's instructions. RT-PCR was performed using GeneAmp® PCR system 9700 (Applied Biosystems, Foster City, CA) in a reaction mixture (20 µl) containing Maxime RT-PCR PreMix (iNtRON Biotechnology, Seongnam, Korea), 500 ng RNA, and 20 pmole of gene-specific primer sets. A reverse transcription reaction for the first strand cDNA synthesis was performed at 45 ° C for 30 minutes, followed by heat inactivation of reverse transcriptase at 95°C for five minutes. A PCR reaction was carried out for 32 cycles of 45 seconds at 95°C, 45 seconds at 55°C, and 60 seconds at 72°C, with a final extension step of five minutes at 72°C. Preliminary PCR runs ascertained that the reactions were in the exponential phase suitable for the quantitative analysis of tyrosinase and GAPDH mRNA. Amplification products were electrophoresed in a 1.2% agarose gel with a 100 bp DNA ladder as a size marker. The gel was ethidium bromide-stained and the band intensities were quantified using a Gel Doc system (BioRad, Hercules, CA). ASSAY OF TYROSINASE ACTIVITY IN VITRO AND IN THE CELLS The in vitro tyrosinase activity was determined by measuring the oxidation of DOPA to DOPA chrome (17). Briefly, the reaction mixture (200 µl) containing cell lysates as a tyrosinase enzyme source (20 µg protein), test materials at different concentrations (0 ~ 1600 µM), and 1.0 mM DOPA as a tyrosinase substrate in 0.1 M sodium phosphate buffer (pH 6.8) was incubated at 3 7°C for 60 minutes. The DOPA chrome formation was determined at 490 nm. To assess the in situ tyrosinase activity, the cells were supplied with 1.0 mM DOPA and incubated for 48 hours. The cell pigmentation was monitored under a microscope. STATISTICAL ANALYSIS Statistical analysis was performed by t-test. The p 0.05, based on at least three or more independent experiments, was considered to be statistically significant.
Purchased for the exclusive use of nofirst nolast (unknown)
From: SCC Media Library & Resource Center (library.scconline.org)