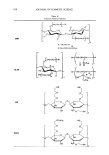
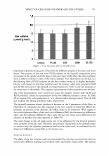
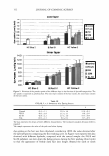
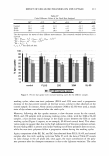
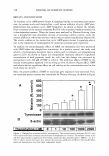
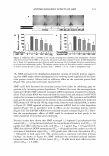
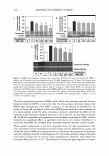
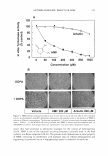
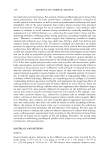
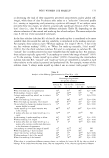
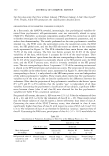
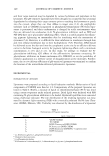
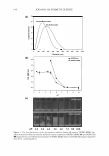
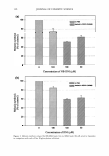
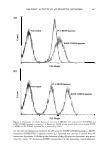
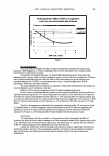
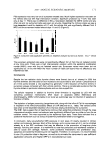
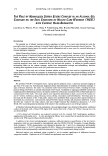
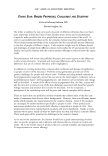
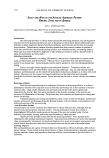
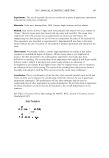
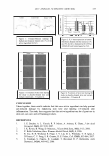
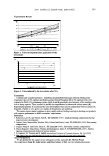
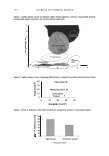
EFFECT OF CELLULOSE POLYMERS ON DYE UPTAKE 113 Table IV Color Difference Values of the Dyed Hair Analyzed LlE 1 ±S.D. Llc2 ±S.D. LlL3 ±S.D. Control 32.7 ±1.0 21.9 ± 1.3 -23.5 ±0.1 PLUS 29.0 ±4.9 20.7 ±3.1 -20.2 ±3.6 SL-60 30.6 ±3.3 20.8 ±3.0 -22.3 ±1.8 The data represent the means of three different measurements. The estimated standard deviation (S.D.) is reported. 1 LlE = [(Ldyed - L) 2 + (adyed - a) 2 + (bdyed - b.) 2 ] 112 2 LlC = [(adyed - a.)2 - (bdyed - b.) 2 ] 112 3 LlL = Ldyed - L. L., a., b 0 = non-dyed yak hair. 100 l · ·-··-····· - - .... ·------- · 90 80 � 70 J! 60 CL ::::1 50 � 40 � 30 20 10 0 control PLUS 250 30M I ■ 3 □ 6 9 washing cycles ! SL-60 Figure 3. Percent dye uptake with increased washing cycles for the different samples. washing cycles, when non-ionic polymers (PLUS and 250) were used, a progressive decrease in the dye percent present on the hair occurs, similar to that observed on the control sample. In contrast, when cationic polymers (30M or SL-60) were used, a steady state of dye release was achieved after the sixth cycle. Moreover, following the dye uptake amount, a slow decrease occurs for the control, PLUS, and 250 samples with increasing washing cycles, while, with the 30M or SL-60 samples, a fast decrease (rapid change in the slope) occurs between the fifth or sixth washing cycles (Figure 4 reports, as an example, SL-60 and control data). This obser- vation seems to suggest that, due to the high substantivity of the ionic polymers on hair, the anti-fading effect is present until a fast washing out of these polymers does not occur, while the non-ionic polymers follow a progressive release during the washing cycles. Again, comparison of the '1E, L1L, and '1C data obtained from PLUS, SL-60, and control samples after the ninth washing cycle (see Table V) with the data of Table IV reveals no color change in the alb plane and, once again, the main contribution of the poly- mer presence after the shampoo treatments is due to the lightness variation. The color

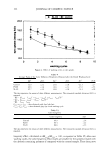
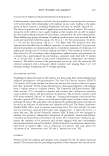
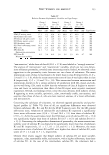
114 JOURNAL OF COSMETIC SCIENCE ♦ SL-60 _...,_control I "ii 18,0 .c 14,0 - 10,0 0 2 4 6 8 10 washing cycles Figure 4. Effect of washing cycles on dye uptake. Table V Average Value of the Color Difference Parameters Obtained after the Ninth Washing Cycle .6.E l ±S.D. .6.C 2 ±S.D. .6.L3 ±S.D. Control 32.9 ±2.2 23.8 ±1.8 -21.3 ± 1.7 PLUS 26.6 ±3.4 19.6 ±2.1 -17.6 ±3.4 SL-60 25.7 ±3.9 19.8 ±2.8 -16.3 ±2.8 The data represent the means of three different measurements. The estimated standard deviation (S.D.) is reported. 1 .6..£ = [(Lwash - Ldyed) 2 + (awash - adyed) 2 + (bwash - bdyed) 2 } 112 2 .6.C = [(awash - adyed) - (bwash - bdyed J 1 3 .6.L = Lwash - Ldyed LdyedJ adyed, bdyed = data obtained with dyed yak hair. Lwash! awash! bwash = data obtained after the ninth washing cycle. Table VI Color Longevity Color longevity Control 96.9 PLUS 86.4 SL-60 86.6 S.D. ±2.4 ± 1.2 ±2.4 The data represent the means of three different measurements. The estimated standard deviation (S.D.) is reported. longevity effect, calculated as fJ.E wa s/ fJ.E dyed x 100, is reported in Table VI after nine washing cycles, the color longevity effect results are smaller for the samples treated with the dyebath containing polymers if compared with the control sample. These data prove
Purchased for the exclusive use of nofirst nolast (unknown)
From: SCC Media Library & Resource Center (library.scconline.org)