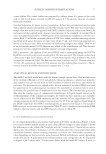
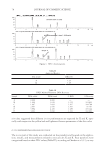
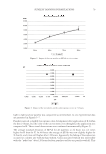
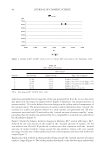
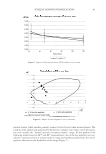
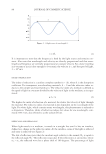
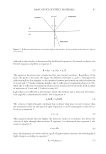
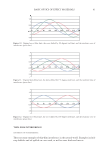
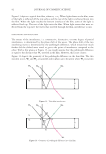
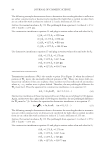
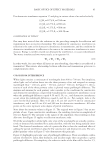
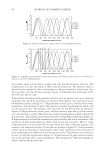
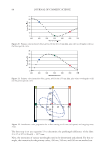
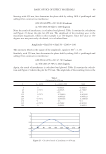
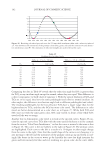
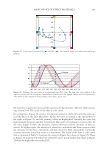
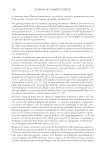
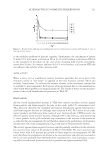
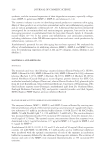
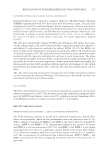
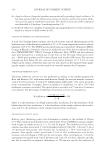
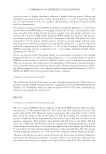
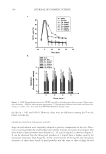
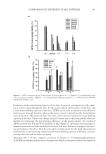
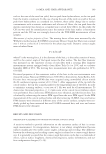
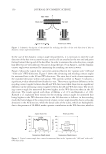
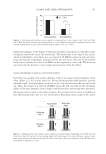
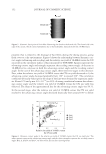
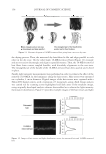
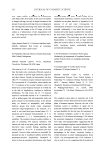
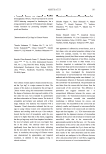
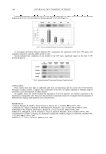
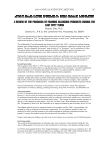
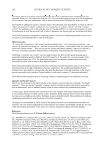
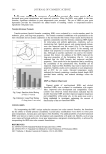
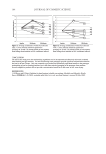
JOURNAL OF COSMETIC SCIENCE 88 INTERFERENCE OF WAVES SINE WAVE A light wave can be mathematically represented by the function in equation 8: y sin x) = ( (8) One wavelength is depicted when the function is evaluated from 0 to 2π, or 360 degrees. Figure 3 shows the sine wave. PHASE SHIFT A phase shift is the number of degrees (radians) that a wave is shifted in the x direction. The sine wave function is modifi ed, as in equation 9, where p is the phase shift: y sin x p) = − ( (9) Because 2π radians and 360 degrees represent a full circle as well as a full wavelength, there are equivalent phase shifts such that = π = π = π 0 2 (360) 4 (720) 6 (1080) π = π = π = π (180) 3 (540) 5 (900) 7 (1260) and π = π = π = π/2 /2 (90) 5 /2 (450) 9 /2 (810) 13 (1170) The result of a phase shift on the original wave is depicted in the following fi gures. Figure 4 shows a phase shift of 45 degrees, Figure 5 shows a phase shift of 90 degrees, Figure 6 shows a phase shift of 135 degrees, and Figure 7 shows a phase shift of 180 degrees. INTERFERENCE Interference occurs when two waves are in same space at the same time. When two waves interfere, the resultant wave is the sum of the y values for each x value. It is very common Figure 3. Depiction of a sine wave evaluated for one wavelength.

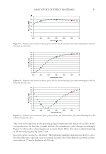
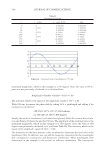
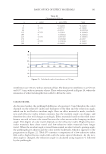
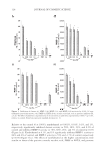
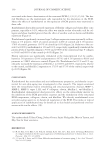
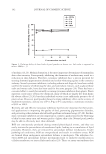
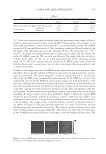
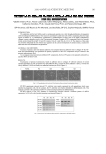
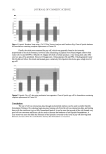
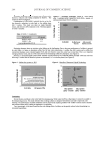
BASIC OPTICS OF EFFECT MATERIALS 89 to have the phase of one wave shifted relative to the other. Figure 8 depicts a wave and a wave that is phase shifted by 0 degrees. The values of these two waves are added to give the wave that is the result of interference. It is important to note that the wavelength does not change as a result of interference, only the amplitude (maximum y value). As another example, Figure 9 depicts a wave and a wave that is phase shifted by 45 degrees. Again, the values of these two waves are added to give the wave that is the result of interference. Similarly, Figures 10, 11, and 12 show the result of interference in phases shifted by 90, 135, and 180 degrees, respectively. These fi gures are just a few examples of interference showing a range of amplitudes of the resulting waves. Among these, there are two special Figure 4. Original wave (blue line) compared to the wave shifted by 45 degrees (red line). Figure 5. Original wave (blue line) compared to the wave shifted by 90 degrees (red line). Figure 6. Original wave (blue line) compared to the wave shifted by 135 degrees (red line).
Purchased for the exclusive use of nofirst nolast (unknown)
From: SCC Media Library & Resource Center (library.scconline.org)