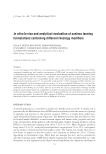
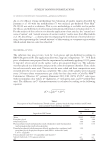
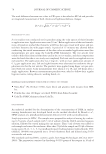
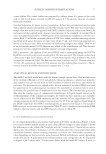
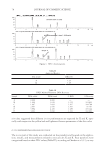
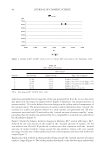
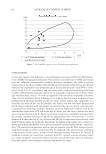
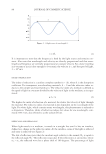
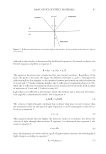
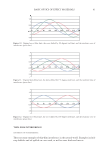
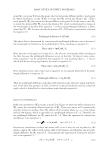
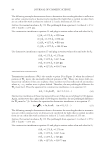
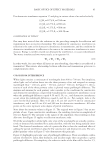
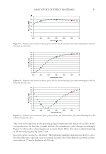
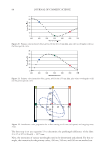
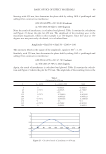
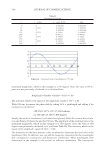
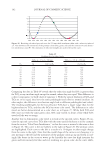
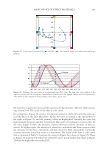
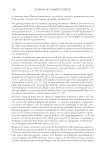
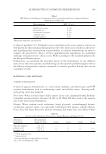
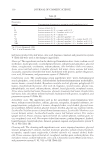
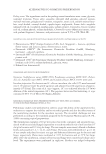
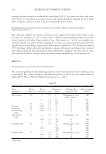
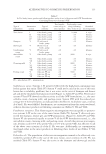
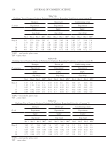
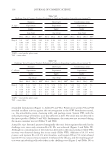
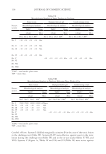
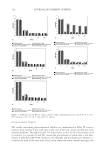
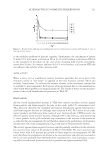
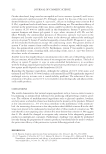
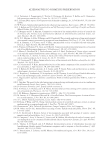
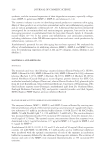
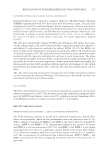
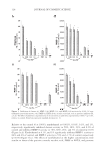
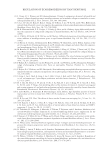
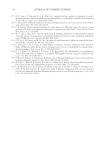
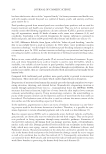
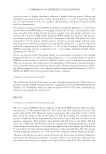
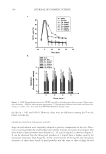
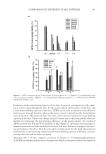
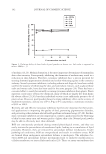
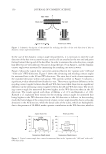
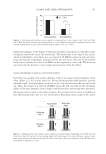
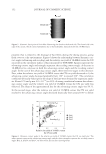
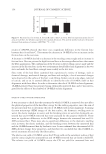
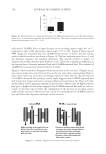
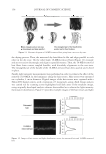
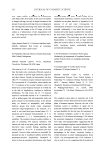
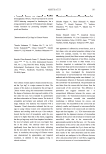
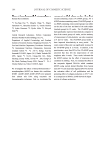
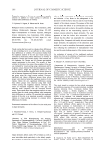
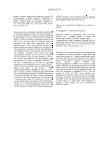
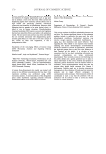
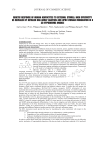
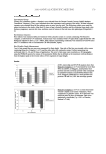
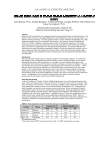
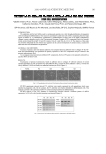
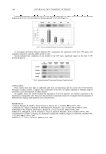
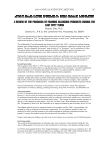
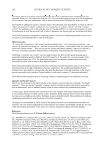
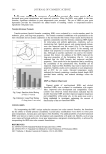
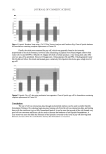
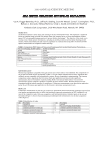
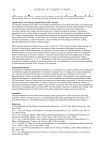
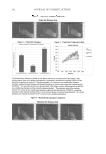
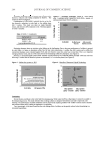
JOURNAL OF COSMETIC SCIENCE 102 Comparing the data in Table IV reveals that the refraction angle for SiO2 is greater than for TiO2 at any incident angle except for normal, where they are equal. This difference is a direct consequence to Snell’s Law of equation 4. With the optical thickness of SiO2 and TiO2 set to be equal, they have the same pathlength (and color) at normal incident. At other angles, the differences in refraction angle lead to different pathlengths (and colors). The resulting pathlengths for the low-refractive SiO2 have a larger range than for the higher-refractive TiO2, and thus the SiO2 has more color travel. The differences in color travel are better demonstrated on a color chart, as in Figure 27. While both TiO2 and SiO2 start out with the same green color, TiO2 only travels to about a blue while SiO2 travels all the way to orange. Another way to demonstrate color travel is to look at the spectral curves. Figure 28 con- tains the spectral curves for a TiO2 fi lm with the same optical thickness as in the example from the section “Color From Interference,” so that the curve at normal is the same as that in Figure 26. This curve is the one farthest to the right in Figure 28. The primary colors are highlighted. Each curve to the left is a result of a 10-degree incident angle change from the curve to the right. Note that the overall shape of the curve is not changing it is just moving to the left and the intensities of the primary colors go up and down accord- ingly, like buoys in the ocean as waves go by. Initially the curve has high intensity for green and low intensity for blue and red, resulting in a green color. As the curve shifts, Table IV Pathlength vs Incident Angle SiO2, n = 1.5, d = 250 nm TiO2, n = 2.5, d = 150 nm θ1 θ2 2nd Cos θ2 θ2 2nd Cos θ2 0 0.0 750 0.0 750 10 6.6 745 4.0 748 20 13.2 730 7.9 743 30 19.5 707 11.5 735 40 25.4 678 14.9 725 50 30.7 645 17.8 714 60 35.3 612 20.3 704 70 38.8 585 22.1 695 80 41.0 566 23.3 689 Figure 26. Resulting calculated spectral curve for 255-nm-thick interference fi lm with a refractive index of 2.5. Also shown are the intensities of the primary colors (blue, green, red) and the constructive and destruc- tive interference cases (●). The intensities of other wavelengths are used to fi ll out the curve.

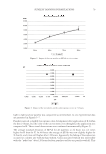
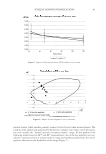
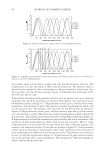
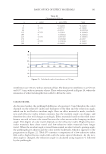
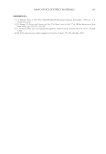
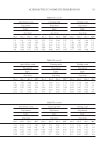
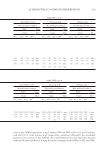
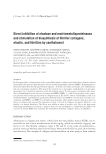
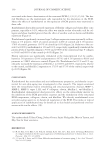
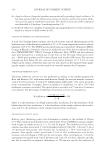
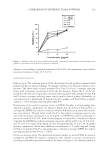
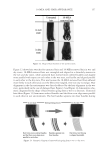
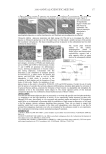
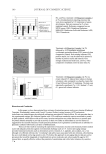
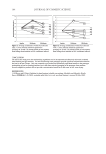
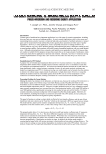
BASIC OPTICS OF EFFECT MATERIALS 103 the intensity of green decreases and the intensity of blue increases. The red, while increas- ing, remains low. The result of the shift is color travel. For comparison, Figure 29 contains the spectral curves for a SiO2 fi lm with the same op- tical thickness as the TiO2 fi lm above. Again, the curve at normal is the one farthest to the right in Figure 29, and the primary colors are highlighted. Initially the curve has high intensity for green and low intensity for blue and red, resulting in a green color. As the curve begins to shift, the intensity of green decreases and the intensity of blue in- creases. At higher angles, the intensity of green hits a minimum and then increases while the intensity of blue hits a maximum and then decreases. Red, meanwhile, continually increases from the initial low value to a maximum. The result of the shift is color travel that is captured in Table V. Compare the curves in Figure 28 to those in Figure 29. Those in Figure 29 with the low-refractive-index SiO2 move much farther than those in Figure 28 with the high-refractive-index TiO2. Figure 27. Color travel plot for TiO2 (■) and SiO2 (▲). The normal angles are indicated with larger markers. Figure 28. Shifting color curves due to incident angle for a TiO2 fi lm. The dark blue curve farthest to the right is at normal and the olive green curve farthest to the left is for 80 degrees. Others are at 10-degree steps. Also shown are the intensities of the primary colors (blue, green, red).
Purchased for the exclusive use of nofirst nolast (unknown)
From: SCC Media Library & Resource Center (library.scconline.org)