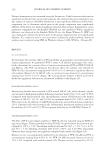
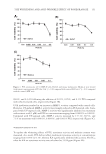
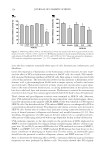
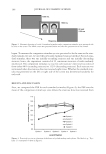
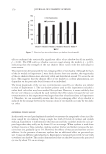
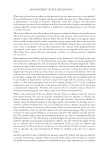
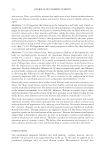
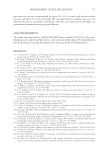
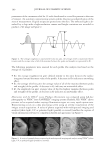
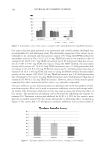
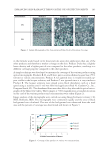
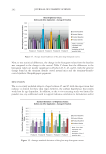
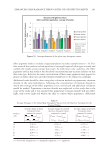
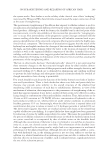
JOURNAL OF COSMETIC SCIENCE 182 Gac extract thus has great potential as an antioxidant and could be further developed into an antiwrinkle (11) and whitening cream. The antioxidant properties of Gac extract are at- tributable to its carotenoid and beta-carotene content (25). Using the DPPH method, the antioxidant activity of Gac (41.25 ± 0.34 mg TEAC/ml extract) was similar to that of vitamin C (41.084 ± 0.277 mg TEAC/ml extract), but 5.85-fold greater than that of vita- min E (7.045 ± 0.427 mg TEAC/ml extract). Using the ABTS method, the antioxidant activity of Gac extract (47.70 ± 0.18 mg TEAC/ml extract) was 1.27-fold greater than that of vitamin C (37.473 ± 0.136 mg TEAC/ml extract) and 11.46-fold greater than that of vitamin E (4.16 ± 1.385 mg TEAC/ml extract). Using the FRAP method, the antioxidant activity of Gac extract (105.03±2.326 mg TEAC/ml extract) was 2.87-fold greater than that of vitamin C (36.514 ± 1.244 mg TEAC/ml extract) and 2.28-fold greater than that of vitamin E (45.869 ± 1.522 mg TEAC/ml extract). However, these activities may be partly augmented by other constituents in Gac extract, e.g., phenolic compounds. Tyrosinase inhibitory activity. Tyrosinase plays an important role in the biosynthesis of mel- anin from tyrosine. Kojic acid is used in tyrosinase inhibitory activity and storage stabil- ity studies (26). Tyrosinase inhibitory activity was used to assess the whitening effect of Gac extract. The production of melanin can be decreased by inhibiting the enzyme ty- rosinase (18). Tyrosinase activity was inhibited by 62.83 ± 1.99% by Gac extract, more than the acceptable value (50%) for creams that produce a whitening effect. As shown in Figure 5, Gac extract had 1.51-fold greater tyrosinase inhibitory activity than vitamin C Figure 4. Antioxidant activity of Gac extract, vitamin C, and vitamin E measured as mg TEAC/ml extract. Figure 5. Tyrosinase inhibitory activity of Gac extract, vitamin C, and vitamin E.

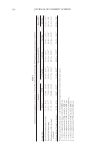
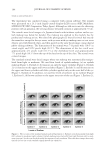
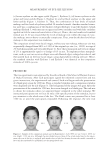
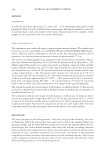
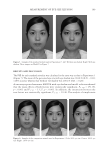
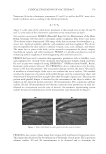
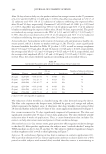
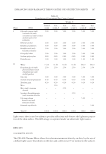
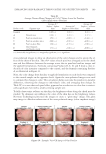
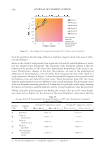
CLINICAL EVALUATION OF GAC EXTRACT 183 (41%) and 2.06-fold greater activity than vitamin E (30%). Under the same test condi- tions, kojic acid exhibited 95.9% tyrosinase inhibition (27). IN VIVO CLINICAL TESTS Moisturizing effect. The skin moisturizing effect can be determined by analyzing the amount of moisture in the stratum corneum (28) to determine the cutaneous hydration rate. The analysis was conducted on subjects who had moderate to slightly dry skin on the face with a cutaneous hydration rate 70 AU on day 0 before using the product demonstrated in Table II. The product induced a signifi cant increase in the cutaneous hydration rate (9% and 10% at 28 and 56 days, respectively, p = 0.038 and p = 0.048). A p value of less than 0.05 was considered signifi cant. A moisturizing effect was observed in 69% of the subjects at 28 days and 75% of the subjects at 56 days. The moisturizing experiment thus verifi ed that the Gac cream was effi cacious in increasing skin moisture and was suitable as a skin care product. Table II Skin Hydration Effects after 28 and 56 Days Cutaneous Hydration Rate Kinetic % on average p Signifi cance Number of subjects exhibiting a positive effect (%) (mean ± SEM) 70 AU (28-D0) 4.50 ± 1.97 9 0.038 Yes 69 (56-D0) 5.33 ± 2.47 10 0.048 Yes 75 p values 0.05 were regarded as signifi cant. Table III Skin Colorimetric Parameters after 28 and 56 Days of Gac Extract Cream Use Parameter Kinetic % on average p Signifi cance % of subjects exhibiting the expected effect (mean ± SEM) L* (28-D0) −0.12 ± 0.17 −0 0.486 No 32 b* (28-D0) +0.09 ± 0.19 +0 0.439 No 59 ITA° (28-D0) −0.4 ± 0.4 −1 0.329 No 23 L* (56-D0) +0.16 ± 0.14 +0 0.265 No 45 b* (56-D0) +0.11 ± 0.18 +1 0.557 No 32 ITA° (56-D0) +0.3 ± 0.3 +1 0.393 No 32 p values 0.05 were regarded as signifi cant. Whitening effect. The skin lightening effect of the Gac extract cream was evaluated using a Chroma Meter® (Osaka, Japan) to measure the colorimetric parameters L* and b* as well as the ITA° of the human skin. The comparison was based on the values obtained on the treated zone before and after 28 and 56 days of use, described in Table III. A synthesis of the variations in the parameters L* and b* as well as ITA° were obtained after 28 and 56 days of product use. Percentage of subject exhibiting the expected effect came from number of subjects who had skin color changing measure by Chroma meter devices (if variation ≥ 0.1) after 28 days and 56 days calculate to percentage.
Purchased for the exclusive use of nofirst nolast (unknown)
From: SCC Media Library & Resource Center (library.scconline.org)