JOURNAL OF COSMETIC SCIENCE 148 ELASTASE INHIBITION ASSAY The elastase inhibition assay was performed by measuring the release of p-nitroaniline due to proteolysis of N-succinyl-(Ala)3-p-nitroanilide by human leucocyte elastase (Sigma-Aldrich) (22) in the presence or absence of PCS solution (0.05%, 0.1%, and 1%) or phosphoramidon (PPR, 10 μM) as a standard under exactly the same experimental conditions. The absorbance was measured at 405 nm with a 96-well microplate reader and the elastase inhibitory activity of each sample was calculated as follows: elastase in- hibitory activity (%) = 100-[(ODs/ODc) × 100], where ODs is the absorbance of the ex- perimental sample at 410 nm and ODc is the absorbance of the vehicle-treated control at 410 nm. The results are reported in terms of IC50 (the concentration at which the per- centage inhibition of elastase activity was 50%). MEASUREMENTS OF PROCOLLAGEN SYNTHESIS HDF-N cells were seeded in 48-well plates. Cells were treated with medium containing various concentrations of PCS solution (0.05%, 0.1%, and 1%) and then further culture for 24 hours. Culture medium was used for the determination of collagen synthesis. The collagen content was determined by procollagen type I C peptide enzyme-linked immu- nosorbent assay (ELISA) kit (MK101, Takara, Japan). TYROSINASE INHIBITION ASSAY Tyrosinase inhibition was tested according to Masamoto’s method (23). Briefl y, aliquots (0.05 ml) of PCS (0.05%, 0.1%, and 1%) were mixed with 0.5 ml of L -DOPA (Sigma- Aldrich) solution (1.25 mM) and 0.9 ml of sodium acetate buffer solution (0.05 M, pH 6.8), and preincubated at 25°C for 10 min. Then, 0.05 ml of an aqueous solution of mushroom tyrosinase (333 U/ml Sigma-Aldrich) was added to the mixture. This solu- tion was immediately monitored for the formation of dopachrome by measuring the lin- ear increase in optical density (OD) at 475 nm with a UV/V is spectrophotometer, and the tyrosinase inhibitory activity of each sample was calculated as follows: tyrosinase in- hibitory activity (%) = 100-[(ODs/ODc) × 100], where ODs is the absorbance of the ex- perimental sample at 475 nm and ODc is the absorbance of the vehicle-treated control at 475 nm. The results are reported in terms of IC50 (the concentration at which the percent- age inhibition of tyrosinase activity was 50%). Kojic acid (KA 1.25, 2.5, 5, 10, 20 and 40 μg/ml) was used as a standard under exactly the same experimental conditions. MELANIN FORMATION TEST IN MELAN-A CELLS Melanin content was measured according to the method of Hosoi (24) with slight modifi ca- tions. Melan-a cells were exposed to various concentrations of PCS solution (0.05%, 0.1%, and 1%). At the end of the treatment, the cells were lysed with 800 μl of 1 N NaOH (Merck KGaA, Darmstadt, Germany) containing 10% dimethyl sulfoxide (DMSO Sigma- Aldrich) for 1 h at 80°C. The absorbance at 400 nm was measured using a microplate

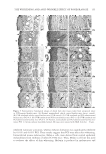
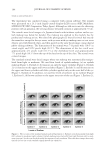
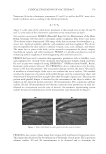
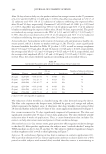
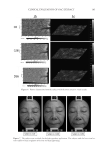
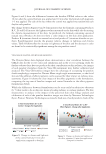
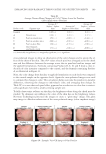
THE WHITENING AND ANTI-WRINKLE EFFECT OF PONEGRANATE 149 reader. The inhibitory activity of each sample against melanin production was calculated as follows: inhibitory activity (%) = 100-[(ODs/ODc) × 100], where ODs is the absorbance of the experimental sample at 400 nm and ODc is the absorbance of the α-melanocyte stimu- lating hormone (MSH)-treated control at 400 nm. The results are reported in terms of IC50 (the concentration at which the percentage inhibition of melanin production was 50%). MMP-1 INHIBITION ASSAY The assay was carried out using a fl uorescence microplate with modifi ed methods of Losso (25). After HDF-N cells were incubated with PCS (0.05%, 0.1%, and 1%) in the absence or presence of 312 nm UVA (5 J/cm2) for 20 min and then cultured for 24 h. The UVA source was a UV irradiation system (VILBER, Loumat, France). The average radiation intensity was approximately 3 mW/cm2. Total MMP-1 protein levels in cell culture supernatants, which includes pro, active, and inhibitor-bound MMP-1, were quantifi ed by ELISA (Human Total MMP-1 DuoSet, DY901 R&D Systems) and MMP activity using an MMP-1-specifi c activity assay (Hu- man Active MMP-1 Fluorokine E Kit F1M00 R&D Systems) according to the manufac- turer’s instructions. HISTOMORPHOMETRICAL ANALYSIS IN VIVO The histopathological profi les of each hematoxylin and eosin (H&E)-stained dorsal back skin tissues were observed under light microscope (Nikkon, Tokyo, Japan). To more de- tail changes, number of formed microfolds on the surface of epithelium (folds/mm of epithelium), mean epithelial thicknesses (μm/epithelium), and mean numbers of infl am- matory cells infi ltrated in the dermis (cells/mm2 of dermis) were calculated for general histomorphometrical analysis using a computer-assisted image analysis program (iSolu- tion FL ver 9.1, IMT i-solution Inc., Quebec, Canada) with collagen fi ber occupied regions in the dermis (%/mm2 of dermis), according to our established method (26), respectively. The histopathologist was blind to group distribution when this analysis was made. Fifty- four dorsal back skin tissue H&E-stained histological samples (three tissues in one slide three slides per group, total six groups—54 dorsal back skin tissues) were analyzed. Each group is as follows: intact control—normal nonirradiated vehicle control hairless mice UVB control—UVB-irradiated vehicle control hairless mice PCS-0.5—UVB-irradiated and PCS 0.5 ml/kg administrated hairless mice PCS-1—UVB-irradiated and PCS 1 ml/kg administrated hairless mice PCS-2—UVB-irradiated and PCS 2 ml/kg administrated hairless mice intact PCS-1—normal nonirradiated and PCS 1 ml/kg administrated hair- less mice. STATISTICAL ANALYSES All in vitro data are expressed as the mean ± standard deviation (S.D.) of fi ve independent experiments, and skin water content was calculated as the mean ± S.D. of eight mouse skins at each time point. Multiple comparison tests for different dose groups were conducted.
Purchased for the exclusive use of nofirst nolast (unknown)
From: SCC Media Library & Resource Center (library.scconline.org)