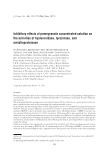
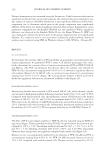
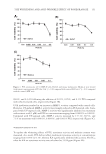
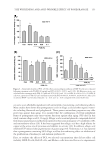
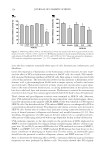
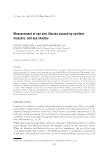
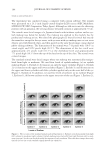
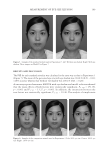
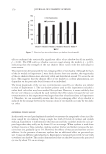
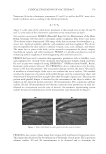
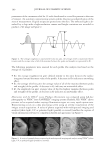
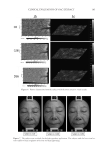
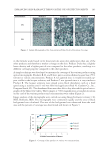
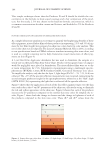
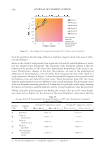
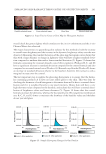
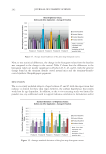
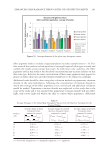
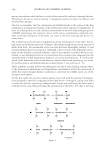
JOURNAL OF COSMETIC SCIENCE 150 Variance homogeneity was examined using the Levene test. If the Levene test indicated no signifi cant deviations from variance homogeneity, the obtained data were analyzed by one- way analysis of variance (ANOVA) followed by a least signifi cant differences (LSD) multi- comparison test to determine which pairs in the group comparison were signifi cantly different. If the Leven test showed signifi cant deviation from variance homogeneity, a non- parametric comparison test, the Kruskal–Wallis H test, was conducted. When a signifi cant difference was observed in the Kruskal–Wallis H test, the Mann–Whitney U (MW) test was conducted to identify the specifi c pairs in the group comparison that were signifi cantly different. IC50 values for each in vitro assay were calculated by probit methods. Statistical analyses were conducted using SPSS for Windows (release 14.0K SPSS Inc., Chicago, IL). RESULTS PCS CYTOTOXICITY To investigate the cytotoxic effects of PCS and defi ne an appropriate concentration for sub- sequent experiments, we performed WST-1 assays. Cell survival percentages were calcu- lated to determine the cytotoxic effects of various concentrations of PCS in HDF-N, HaCaT, and Melan-a cells. PCS concentrations that did not affect cell viability were selected. In HDF-N cells, concentrations ranging from 0.005% to 0.1% showed no signifi cant effect on cell numbers (Figure 1A). In HaCaT cells, no cytotoxicity was observed at concentrations ranging from 0.01% to 0.1% (Figure 1B). Concentrations between 0.005% and 0.01% showed no signifi cant reduction in cell survival in Melan-a cells (Figure 1C). MOISTURIZING BENEFITS OF PCS Moisturizing benefi ts were examined in PCS-treated HaCaT cells, which showed a signifi - cant increase in hyaluronan synthesis following treatment with 0.05%, 0.1%, and 1% PCS. Compared with vehicle-treated cells, the hyaluronan content of PCS-treated cells showed increases of 168.2%, 413.1%, and 542.6% on treatment with 0.01%, 0.05%, and 0.1% PCS, respectively. In addition, 20 mM NAG signifi cantly increased hyaluronan synthesis to 255% compared with vehicle-treated cells. Interestingly, hyaluronan synthesis induced by the addition of 0.05% and 0.1% PCS was greater than that by 20 mM NAG (Figure 2). ANTIWRINKLE BENEFITS OF PCS The effect of PCS on procollagen synthesis in HDF-N cells was evaluated using an ELISA for type I procollagen. Tumor growth factor beta (TGF-β, 10 ng/ml) altered the activity of pro- collagen by 150.9 ± 5.4%. Procollagen synthesis decreased by 96.5 ± 7.4%, 53.4 ± 8.5%, and 53.0 ± 4.4% following treatment with 0.01%, 0.05%, and 0.1% PCS, respectively. However, these changes were not signifi cant compared with control cells (Figure 3A). Elastase activity was signifi cantly inhibited by the addition of PPR (10 μM) and PCS at concentrations ranging from 0.05% to 1%. PPR (10 μM) decreased elastase activity by 74.9 ± 6% compared with vehicle-treated cells. Elastase activity increased by 92.3%,

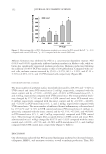
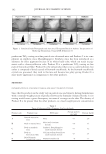
THE WHITENING AND ANTI-WRINKLE EFFECT OF PONEGRANATE 151 89.6%, and 6.3.6% following the addition of 0.01%, 0.05%, and 0.1% PCS compared with vehicle-treated cells, respectively (Figure 3B). UVA irradiation resulted in an increase in MMP-1 activity compared with control cells. However, UV-induced MMP-1 activity was strongly reduced in PCS-treated cells. Com- pared with UV-exposed cells, MMP-1 activity was signifi cantly inhibited on treatment with retinoic acid (1 μM) and PCS at concentrations ranging from 0.0001% to 0.001%. Compared with UV-exposed cells, MMP-1 activity increased by 137.1%, 69.3%, and 7.1% on treatment with 0.0001%, 0.0005%, and 0.001% PCS, respectively (Figure 3C). WHITENING EFFECTS OF PCS To explore the whitening effects of PCS, tyrosinase activity and melanin content were measured. As a result, PCS did not affect mushroom tyrosinase activity at concentrations ranging from 0.05% to 0.1%, whereas KA signifi cantly inhibited this activity. The IC50 value for KA on tyrosinase activity was calculated as 3.634 ppm (Figure 4A). Figure 1. PCS cytotoxicity. (A–C) HDF-N cells, HaCaT, and mouse melanocytes (Melan-a) were treated with various concentrations of PCS for 24 h. a p 0.01 compared with control (LSD test) b p 0.01 compared with the control (MW test).
Purchased for the exclusive use of nofirst nolast (unknown)
From: SCC Media Library & Resource Center (library.scconline.org)