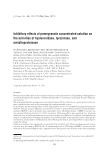
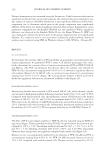
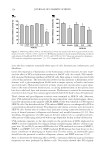
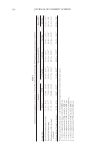
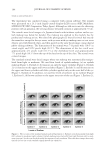
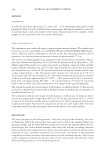
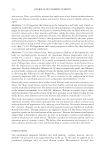
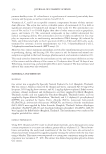
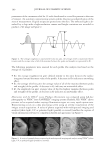
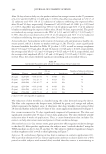
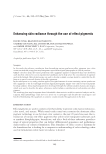
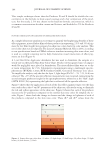
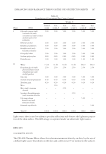
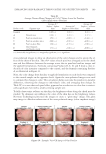
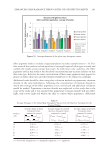
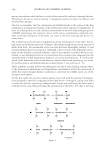
JOURNAL OF COSMETIC SCIENCE 192 pearlescent TiO2 coating on a fi ne particle size of natural mica and Product C is its com- pliment on synthetic mica (fl uorphlogopite). Synthetic mica has been introduced as a substrate for effect pigments because of its whiter bulk color, which can result in pig- ments with a cleaner refl ection color. Product D is a pearlescent TiO2 coating on fi ne particle borosilicate fl ake. Product E is the only product that is not a coated substrate, but rather is composed of dried crystals of bismuth oxychloride. As the bismuth oxychloride crystals are processed, they tend to fracture and become less platy giving Product E a more matte appearance in comparison to the other products. METHODS DETERMINATION OF UNIFORM COVERAGE FOR EFFECT PIGMENTS STUDIED Since the fi ve products in the study vary in particle size and density, having formulations with a constant weight percent of product between the formulas evaluated for the in vivo testing would cause a great discrepancy in terms of coverage on the skin. The density of Product E is far greater than the other products, so a fi xed weight percent concentration Figure 1. Simulated Study Photographs and Associated Histograms Based on Authors’ Interpretation of Marketing Terminology Using ASTM Defi nitions (6) Table I Types of Substances/Effect Pigments Used in the Study Product code Pigment type INCI name Average particle size (μm) Density (kg/L) A Natural muscovite mica Mica ∼11 2.8 B Pearl on natural mica Mica (and) titanium dioxide ∼10 3.4 C Pearl on synthetic mica Synthetic fl uorphlogopite (and) titanium dioxide ∼11 3.2 D Pearl on borosilicate fl ake Calcium sodium borosilicate (and) titanium dioxide ∼21 2.5 E Dried bismuth oxychloride crystal Bismuth oxychloride ∼9 7.7

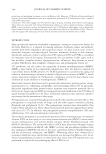
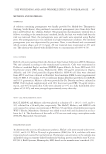
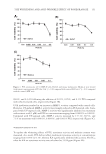
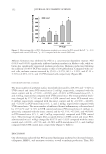
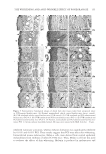
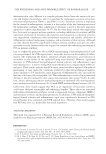
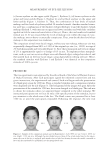
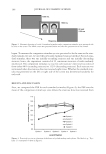
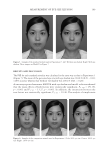
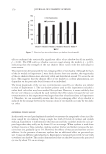
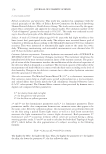
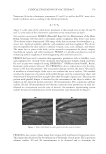
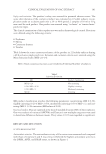
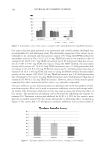
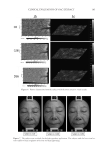
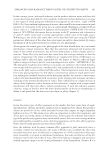
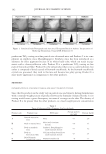
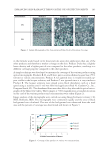
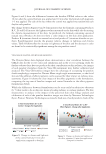
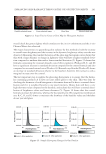
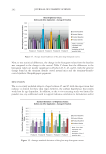
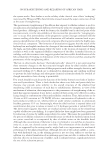
ENHANCING SKIN RADIANCE THROUGH THE USE OF EFFECT PIGMENTS 193 in the formula would result in far fewer particles upon skin application than any of the other products and therefore a weaker coverage on the skin. Product D also has a slightly lower density and a higher particle size compared to the other products, resulting in a different coverage property compared to the other products. A simple technique was developed to measure the coverage of the various products using optical micrographs. Products B, D, and E were put in a nitrocellulose lacquer base (75% solvent) at various concentrations. Product A was ignored since it would not readily ap- pear visible in the lacquer solution, and Product C was ignored since is it very similar to Product B. The lacquer solutions were spread across black drawdown cards at a fi xed speed using a stainless steel 3 mil wet fi lm bird applicator (Paul N. Gardner Co., Inc., Pompano Beach, FL). The drawdown fi lms were then left to dry, after which optical micro- graphs of the fi lms were taken. Three images at 700× magnifi cation at random locations on the card of the various products and concentrations were taken (Figure 2). Image analyses of the micrographs were carried out using ImageJ software (version 1.48, NIH, Bethesda, MD). The micrographs were contrasted equally and the area of black background was calculated. The area of the background was subtracted from the total area and the percent of coverage was determined and shown in Figure 3. Figure 3. Coverage of the products at various wet concentrations. Figure 2. Sample Micrographs of the Concentration Films Used to Determine Coverage
Purchased for the exclusive use of nofirst nolast (unknown)
From: SCC Media Library & Resource Center (library.scconline.org)