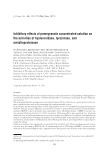
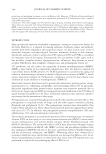
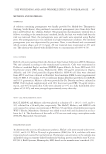
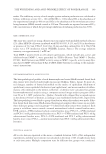
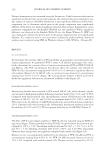
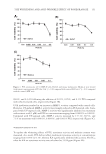
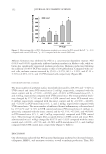
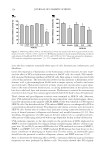
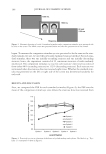
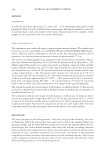
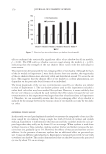
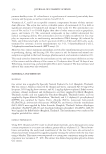
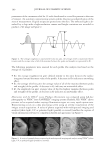
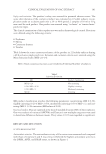
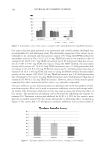
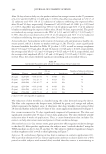
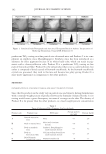
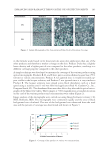
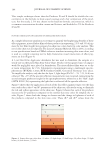
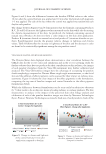
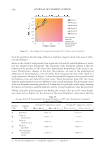
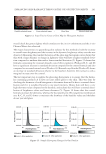
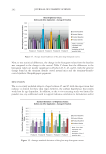
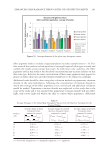
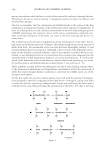
JOURNAL OF COSMETIC SCIENCE 194 This simple technique shows that the Products D and E should be double the con- centration in the formula to show equal coverage and a fair comparison of the prod- ucts. For the study, 2.5% was chosen to the baseline formula concentration, which is a common concentration for skin creams and lotions, and doubled to 5% for Products D and E. IN VITRO: SIMULATION OF RADIANCE ON SIMULATED SKIN COLOR As a simple laboratory simulation to attempt to quantify the brightening benefi ts of these effect pigments, nitrocellulose fi lms of these products incorporating 2.5% and 5% of pig- ment by wet fi lm weight were prepared on skin tone color charts for color analysis. This novel color chart was developed by The Leneta Company (Mahwah, NJ), in 2001, according to our specifi cations based on CIELab values to simulate increasing skin tone colors, and is used as a simple screening tool to help characterize visual interactions of effect pig- ments on skin (Figure 4). A 3-mil Bird Film Applicator drawdown bar was used to drawdown the samples at a steady rate on the Leneta Skin Tone Color Chart. Product A was ignored since its impact would be negligible once placed in formulation. The nitrocellulose fi lms were set to dry at room temperature for 24 h. Colorimetric measurements using a multiangle spectro- photometer (BYKMac 12mm, BYK-Gardner GmbH, Geretsried Germany) were taken. To simplify the analysis, only the data for layer 2, light beige (L*a*b* = 78, 7.25, 14.8) was collected. The +25º off the specular refl ection measurements were reviewed, representing the second strongest pearlescent angle for the spectrophotometer, referred to as the “fl ash” angle (ASTM E284-13b), representing the light that is redirected off the specular refl ection. Figure 5 shows that the application of each of the four effect pigment types over the skin tone card reduces the a* and b* parameters of the skin tone, effectively acting to diminish the red and yellow appearance of the skin tone. Figure 6 shows that each of the products increases the L* parameter compared to the normal skin tone color. To simplify the re- sults, Figure 7 shows both the change in chroma and the change in lightness of each of the products compared to the skin tone color. These dL* and dC* values show the Figure 4. Leneta skin tone color chart (1) white, (2) light beige, (3) dark beige, (4) yellow-beige, (5) light brown, (6) dark brown, (7) black.

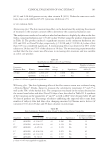
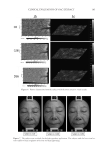
ENHANCING SKIN RADIANCE THROUGH THE USE OF EFFECT PIGMENTS 195 whitening effect of the products at the 25° off-specular angle. This simulation suggests that there is a color adjusting and lightness boosting contribution from the effect pig- ments on the skin tone color card at this measured angle which contributes to the appear- ance of radiance. To support any radiance contribution from these effect pigments on skin, in vivo testing is required as the coated skin tone card will not replicate the contour- ing of a face to demonstrate radiance on the skin. An in vivo screening study carried out to further study this aspect is discussed in the next section. IN VIVO SCREENING OF COLOR AND RADIANCE Design. In a controlled blind study, six female volunteer subjects between the ages of 45 and 65 and with Fitzpatrick type II skin tone (fair skin) applied face creams with or Figure 5. a*b* reduction of the fi lms across the lay er 2 skin tone. Figure 6. L* values of the products across the layer 2 skin tone. Figure 7. Increase in lightness and decrease in chroma on simulated skin color card.
Purchased for the exclusive use of nofirst nolast (unknown)
From: SCC Media Library & Resource Center (library.scconline.org)