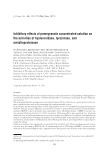
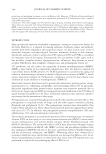
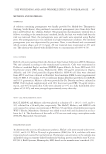
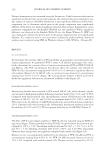
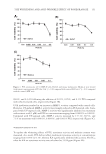
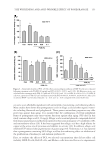
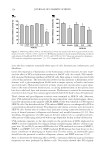
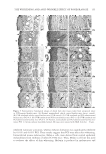
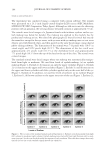
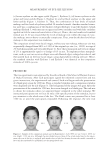
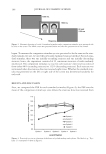
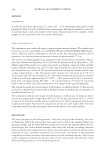
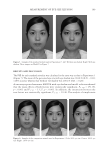
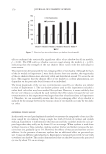
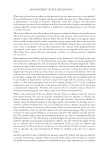
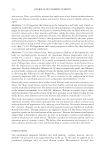
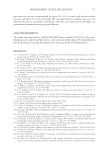
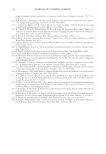
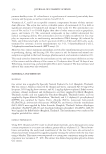
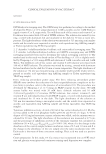
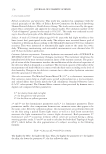
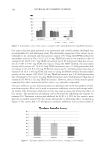
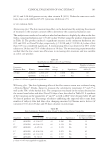
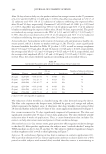
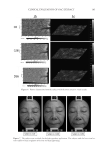
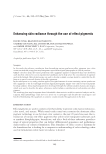
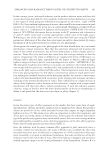
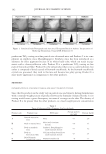
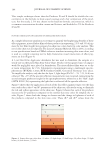
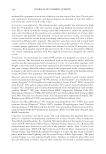
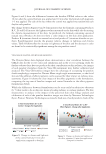
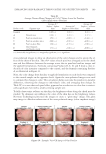
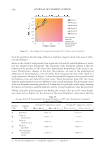
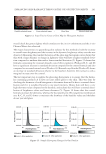
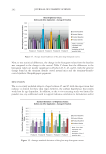
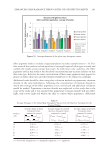
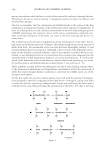
JOURNAL OF COSMETIC SCIENCE 198 Figure 8 and 9 show the differences between the baseline CIELab values to the values 10 min after the control formula was applied and 10 min after the formula with pigments 1–5 was applied. The side of the face where the control was applied was randomized each day for each panelist. The change between Figures 8 and 9 demonstrates that the formulas containing Products B, C, D, and E all increase the lightness values measured on the skin while also decreasing the chroma measurements of the skin. As predicted, the formula containing uncoated natural mica (Product A) does not show a color impact on the skin after application. Product B (titanium dioxide on natural mica) and product C (titanium dioxide on syn- thetic fl uorphlogopite) provide the greatest relative changes in lightness and chroma values. Table III shows that the increase in lightness of the skin and the decrease in color are found to be statistically signifi cant among the six panelists tested. VISIA IMAGE ANALYSIS AND HISTOGRAM RESULTS The Chroma Meter data displayed above demonstrates a clear correlation between the CIELab data for the in vitro color card simulation and in the in vivo screening study. To further evaluate these fi ve test products for their contribution to skin radiance, the images of each panelist’s hemifaces from the Visia CR instrument were further calibrated and analyzed. The Visia CR hemiface images have the advantage of accounting for panelist cheek morphology compared to Chroma Meter single angle measurements, so the facial skin and the addition of effect pigments can be assessed for their impact on radiance mea- surements. Figure 10 shows the clear impact of the effect pigments in the formulation, comparing the top row of baseline images and control formulas to the effect pigment formulations below. While the differences between formulations can be seen easily by subjective observers (6, 7) there needs to be an objective means of scaling radiance to evaluate products. The fi rst characteristic to analyze is the impact of the perceived skin color. Image analysis and calibration of each of the panelist hemiface images was done by Newtone Technologies (Lyon, France). Newtone Technologies sectioned a fi xed area of each panelist’s cheek of the Figure 8. Change in chroma and lightness of the control formula 10 min after application compared to baseline. Figure 9. Change in chroma and lightness of the effect pigments 10 min after application compared to baseline.

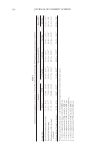
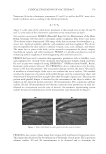
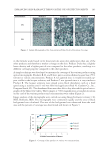
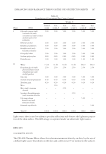
ENHANCING SKIN RADIANCE THROUGH THE USE OF EFFECT PIGMENTS 199 cross-polarized images to allow an observation of the color changes and to ignore the ef- fects of the shine of the skin. The a*b* values of each pixel was averaged across the cheek area and the difference between the average across the six panelists baseline images and the applied formulations. Formulas containing Products B, C, D, and E show a clear re- duction of color intensity compared to the control, and the formula containing Product A, as illustrated in Figure 11. Next, the color change from baseline to applied formulation on each cheek was compared to the control sample on the opposite cheek. Again the cross polarized images were used to compare this change in color. This calculation helps overcome the panelist-to-panelist differences, observing the changes to individual’s color, and averaging that change. In Table IV, it is seen that each pearl effect pigment has a reduction in color that is statisti- cally signifi cant even with a small screening sample size. To fully characterize radiance on the skin, the brightness values along the cheek must be studied. To eliminate any infl uence the color of the skin has on the brightness values, Newtone Technologies processed the images to create a “gloss map” image. The gloss map image is a Boolean subtraction of the cross polarized image (color emphasis image) Table III Average Chroma Meter Changes in L*a*b* Values Across Six Panelists (After Application—Baseline) Product code Pigment type Average dL* (higher = lighter skin) Average da* (higher = redder skin) Average db* (higher = yellower skin) Control – 0.05 (−) −0.06 (−) 0.31 (++) A Natural mica −0.06 (−) −0.20 (−) 0.47 (−) B Pearl on natural mica 1.53 (++) −1.60 (++) −3.44 (++) C Pearl on synthetic mica 2.22 (++) −0.80 (+) −4.06 (++) D Pearl on glass fl ake 1.26 (++) −0.70 (+) −1.90 (++) E Dried bismuth oxychloride crystal 1.74 (++) −1.06 (++) −0.88 (++) (−): Statistically insignifi cant, (+): marginally signifi cant, (++): signifi cant. Figure 10. Example Visia CR Images of One Panelist
Purchased for the exclusive use of nofirst nolast (unknown)
From: SCC Media Library & Resource Center (library.scconline.org)