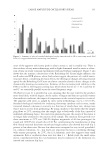
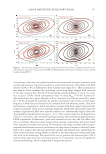
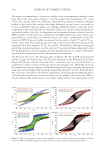
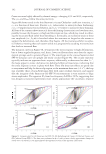
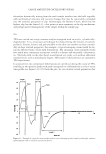
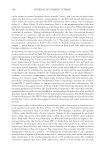
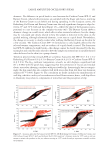
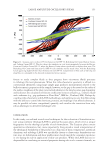
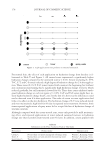
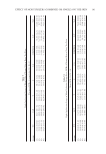
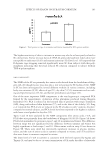
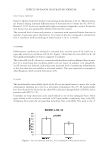
JOURNAL OF COSMETIC SCIENCE 136 rub-in can be enormous. Therefore, the four texture formulations were evaluated by means of LAOS. The reader should note that Lissajous plots from low frequency (i.e., lower oscillatory shear rate) experiments are also introduced in this section, as they illus- trate many useful points when comparing the interaction of rough and smooth surfaces with the tested formulations. Figure 4 shows the viscous Lissajous plots from LAOS ex- periments for the four texture systems in the study. Most of the Lissajous plots in this article are viscous Lissajous plots of stress versus oscillatory shear rate. Each series of curves is plotted full scale so that the dynamics of the contours can be easily examined. Note that the ARES-G2 data are collected in transient mode, which means that the mea- sured oscillatory shear rates are instantaneous shear rates and, hence, may not directly parallel trends in steady state shear rate data. Although traditional rheometry displays a collection of data points that may be taken as almost disjointed facts, the Lissajous plots convey a continuous fl ow of collective rheological changes. The Sunscreen Gel SPF-50. As illustrated in Figure 4A, Sunscreen Gel SPF-50 has a smooth transition from an elastic microstructure (in the LVR) to a fl owing, lightly structured fl uid—as demonstrated by the evolution of symmetrical ellipses at the center to distorted ellipses with line-like “tails” at the highest strain rate. Figure 5A shows the impact of surface roughness on the measurement—where the rough surface displays higher total stress, thereby suggesting that wall slip, or, more likely, shear banding, confound the meaning of the smooth surfaces measurement at low shear rate. Hence, for the sandpaper, the transition of the Lissajous plots to thinner ellipses at higher strain rates suggests a plastic transition from a yield stress fl uid. Although the yield transition in the prototypes Figure 4. Smooth surface viscous Lissajous plots for (A) Sunscreen Gel SPF-50, (B) Refreshing Gel Cream, (C) Buttery Cream, and (D) Cushion Cream SPF-15 formulations. For the same applied strain, the inset in 4C shows stress changes with iterations of the same shear rate. Changes are related to the brittle and waxy mi- crostructure, and the apparent thixotropy is accentuated at the highest oscillatory shear rates. σ0 approxi- mates the location of the apparent yield stress.

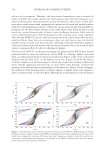
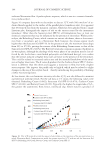
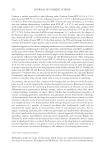
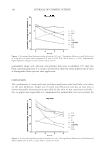
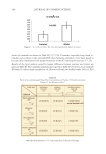
LARGE AMPLITUDE OSCILLATORY SHEAR 137 is less abrupt, and more of a gradual cascade in microstructural strength, experience with visualizing Lissajous trajectories enables a crude determination of yielding via LAOS (denoted as σ0 or σ’0 to differentiate from τ0 from stress ramp data). These guesstimates may then be better confi rmed by correlating critical loop shape changes with extracted G”/G’ (σ0) crossover data. For the 25°C/smooth data shown in Figure 4, the G”/G’ cross- over occurs at 116 Pa, which corresponds to loop 14, where σmax = 116 Pa. A more reli- able method may be to report the peak in σ’ as a function of oscillatory strain (σ’0), where σ’0 = 99 Pa. It should be noted that σ0 and σ’0 calculated in this article are from high- frequency LAOS data and should not be confused with low shear σ0 and σ’0 data from low-frequency experiments, which may better correlate with shear ramp τ0 data and sub- sequent assessment of the at-rest materials properties. Both yield stress results from the dynamic high-shear LAOS data (smooth surfaces) are substantially higher than that determined by standard stress sweeps (i.e., τ0 = 14 Pa), and are indicative of disparities in collective viscoelastic, slip, and shear banding responses while performing high-frequency LAOS experiments. Furthermore, yield stress materials do not obey the Cox–Merz rule hence, oscillatory shear rate values obtained from dynamic experiments will never match those measured in steady state testing. The bending of the loops, and well-defi ned, super- imposed lines between successive iterations at the same strain (compare to Buttery Cream Figure 4C), suggest that the structure breaks quickly and reforms more slowly than the onset of the next strain setting further, iterations at the same shear rate overlay, indicating very little to no thixotropy. The speed of the test to generate the Lissajous plot ( 60 s) and the short delay between each strain increase (2 s) essentially conceal any signifi cant structure rebuilding, which is apparently a longer-time process. Figure 5. Smooth versus rough surface viscous Lissajous overlay (ω = 50 rad/s) to emphasize the low oscilla- tory shear rate region for (A) Sunscreen Gel SPF-50, (B) Refreshing Gel Cream, (C) Buttery Cream, and (D) Cushion Cream SPF-15.
Purchased for the exclusive use of nofirst nolast (unknown)
From: SCC Media Library & Resource Center (library.scconline.org)