LARGE AMPLITUDE OSCILLATORY SHEAR 129 sample loss, and yield, as well as other nonperiodic fl ow instabilities—where dynamic oscillation of the material invokes an asymmetrical stress response to the direction of the applied strain oscillation. Odd harmonics (e.g., I1, I3, I5), on the other hand, refl ect sym- metrical stress responses, such as homogeneous changes in microstructure, which are in- dependent of the direction of oscillation. Dynamic frequency sweep. Using the ARES-G2 and 25-mm parallel plates (smooth and rough surfaces), frequency sweeps were applied at 25° and 32°C to gauge the inherent viscoelasticity as a function of time, where time is inversely proportional to 1/f. The angu- lar frequency was swept from low to high (0.1–100 rad/s) within the LVR (γ = 1% strain) and, in other experiments, well outside the LVR (γ = 50%). Preshear and recovery. Experiments were performed using the ARES-G2 rheometer. The method involves preshearing the sample at a moderate shear rate, followed by a dynamic time sweep to monitor the rebuilding of structure as a function of time. The time depen- dence of structure rebuilding is related to thixotropy. Using both smooth and roughened surfaces, the following settings were applied: preshear = 20 s-1 for 180 s recovery = dynamic time sweep (10 min, 1% strain, 1 rad/s) to monitor trends in G’ as a function of time. Steady torsional. Steady torsional experiments were performed with smooth and rough surfaces using the ARES-G2 rheometer. The shear rate was stepped to 20 s-1 and held steady for 300 s trends in stress and viscosity were followed as a function of time. The test was performed to monitor thixotropy, which is time-dependent shear thinning. Step stress growth. The step growth experiment was performed using the ARES-G2 rheom- eter. The test is transient, where an instantaneous shear strain rate is applied to gauge the initial elasticity. The shear rate was instantaneously stepped from 0 to 50 s-1 and held constant for 300 s using both smooth and rough plate surfaces. Stress ramp. The steady stress ramps were performed using the AR-G2 rheometer. Stress ramps were applied with a stress-controlled rheometer to directly assess the apparent yield stress (τ0) and zero shear viscosity (ZSV) of each material. All four cosmetic formulations exhibit apparent yield stress responses, meaning that their dispersed skeletal microstruc- tures were strong enough to appear solid-like in a jar, and that they actually tend to creep or fl ow very slowly under the application of miniscule shear stresses (i.e., long deforma- tion times). Consequently, the associated fl ow curves portray a ZSV plateau rather than an infi nite viscosity in the limit of zero applied shear rate. Furthermore, only smooth sur- faces were studied, so wall slip and plug fl ow values are comingled in the reported appar- ent yield stress values hence, in the report “yield stress” is sporadically used, but the data are more accurately termed as “apparent yield stress events.” The yield stress was mea- sured at both 25° and 32°C to see the effect of temperature on the τ0 and potential cor- relation with cushion and initial spreadability. The conditioning step included thermal equilibration followed by the application of a small stress (0.100 Pa) for 2 min to build up stress in the material. The shear stress was then ramped from 0.010 to 200 Pa. For each stress measurement, the maximum point collection time was limited to 1 min to curtail drying of the sample at the gap edge. Brookfi eld viscometry. The apparent viscosity of the formulations was measured with a Brookfi eld RVT viscometer and the appropriate T-Bar spindle (Brookfi eld Engineering Laboratories, Inc., Middleboro, MA). The measurement was recorded after equilibrating at 5 rpm and 25°C for 1 min.

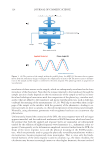
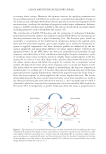
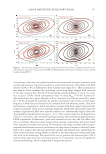
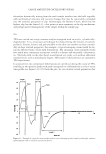
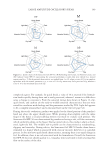
JOURNAL OF COSMETIC SCIENCE 130 LAOS experiments. Using the ARES-G2, dynamic strain sweeps were applied using 25-mm stainless steel parallel plates (R = 12.5 mm) with both smooth and rough surfaces to ascertain the impact of wall slip on the oscillatory stress response. The rough surface was prepared by applying adhesive-backed, 400-grit sandpaper (ARC Abrasives, Inc., Troy, OH) to the top and bottom plates. To attain shear rates more applicable to spreading, the strain sweep was performed at the following settings: transient mode, 1–600% strain, 7 points/decade, 25 half cycles, 128 points/cycle, 2 delay cycles (2 s), ω = 50 rad/s. Note that ordinarily 10–50 delay cycles are used to measure rheological properties of a sample at steady state however, in this study, only two delay cycles were programmed to more realistically approximate the spectrum of microstructural breakdown as a function of suc- cessive iterations at the same shear rate, as well as increasing shear rates. Although some small inaccuracies subsequently propagate to FT analyses for samples exhibiting inherent thixotropy, the very small accuracy loss was less important than monitoring the complete microstructural breakdown of the probed sample. In separate experiments, the presence of wall slip, plug fl ow, and shear banding were crudely characterized by using an iPhone 5s camera (Apple Inc., Cupertino, CA) and a painted marker to assess the visual deforma- tion of the vertical marker as a function of shear rate and angular displacement (see Refer- ences 12 and 17 for a more rigorous analysis). Nonlinear properties were assessed with the TRIOS FT Rheology accessory software package (TA Instruments). The infl uence of elec- trolyte was examined by delivering 500 nmol/cm2 sodium chloride (ACS reagent Al- drich Chemicals, St. Louis, MO) from methanol (ACS reagent, Aldrich Chemicals) to the stainless steel surface of the top plate (transducer side). The treated plate was then predried at 32°C in the ARES-G2 oven before zeroing the geometry gap. Lissajous plots were subsequently generated using the aforementioned strain sweep methodology. Finally, a second set of lower oscillatory shear rate tests was performed to produce Lissajous plots for better visualizing microstructural changes in the apparent at-rest state. The low-frequency strain sweeps were executed with the following settings: transient mode, 1–600% strain, 7 points/decade, 25 half cycles, 128 points/cycle, 2 delay cycles (2 s), ω = 1 rad/s. TEXTURE PROFILE ANALYSIS Texture profi le analysis (TPA) was carried out using a TA.XTPlus Texture Analyzer distrib- uted by Texture Technologies Corp. (Hamilton, MA) and manufactured by Stable Micro Systems (Godalming, Surrey, United Kingdom). It is equipped with a 5-kg load cell with 0.1 g force sensitivity. The Texture Analyzer is essentially a mechanical device with a probe attached to the load arm. Formulations were placed in a sample cell underneath the probe and were subjected to oscillating compression-tension deformation cycles by the probe. A cylindrically-shaped acrylic probe (TA-11 Texture Technologies Corp., Hamilton, MA) was used for the analyses. Typical settings were as follows: probe speed, 1.0 mm/s deforma- tion, 2.0 mm deformation time, 1 s and initial trigger force (point where the 1.0 mm deformation begins), 2 g. Data analysis was conducted with Exponent v6.14.0 soft- ware from Stable Micro Systems (Godalming, Surrey, United Kingdom). SENSORIAL ANALYSIS A fi ve-membered expert panel completed the sensorial analyses. The formulations were evaluated for three distinct sensorial attributes: initial, middle, and fi nish rub-in. An
Purchased for the exclusive use of nofirst nolast (unknown)
From: SCC Media Library & Resource Center (library.scconline.org)