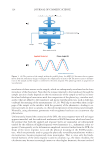
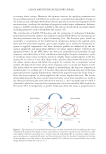
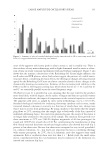
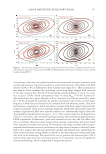
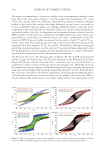
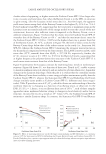
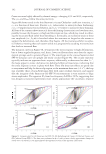
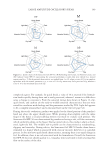
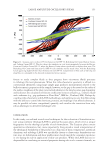
LARGE AMPLITUDE OSCILLATORY SHEAR 143 of the stress ramp data. Further, the rough and smooth data at 25°C and observations from marker data express that the inclination for shear banding is higher at ambient than at skin temperature—hence, the intensity of shear banding for Sunscreen Gel SPF-50 may be tied to temperature-sensitive gradients in microstructural strength. In contrast, the Refreshing Gel Cream (Figure 9B) responds with twice the maximum stress and with much more elasticity. At shear rates of 1 s-1, the physical network of the Refreshing Gel Cream bends but does not break. Figures 5B and 9B further imply that wall slip is indeed very minimal for the Refreshing Cream. The Lissajous profi le shown in Figure 9B indi- cates the high elasticity, and the apparent σ’0 from the low shear rate LAOS data (peak in elastic stress) is 93 Pa, rivaling that of the Cushion Cream (σ’0 = 102 Pa). The prevailing line-like loop shapes in the Buttery Cream (Figure 9C) system are indicative of plug fl ow properties—where the slip layers fl ow and protect the waxy microstructure of the Buttery Cream from the full brunt of the applied strains. The vertical inner loops eventually por- tray yield (σ’0 = 63 Pa), but the accuracy of the response is no doubt masked by interfacial slip. The Lissajous plot for the Cushion Cream SPF-15 in Figure 9D resembles that of a fl owing fl uid—clearly this illustrates the effects of low shear rates inducing slip and plug fl ow processes, where slip provided by the acrylic beads and cohesiveness from the polymeric- driven microstructure overwhelm the weaker plate-sample adhesion forces. One trend to note is the difference (Δ) between the high and low LAOS shear rate (σ’0) yield data: Sunscreen Gel SPF-50 (Δ = 7 Pa), Refreshing Cream (Δ = 7 Pa), Cushion Cream SPF-15 (Δ = 24 Pa), and Buttery Cream Cream (Δ = 23 Pa). These data indicate that the response to imposed transient strain for the Cushion Cream SPF-15 and Buttery Cream are time dependent. Further, based on comparisons between the Lissajous plots in Figures 4 and 9, the responses are at least partially masked by interfacial slip and plug fl ow effects that no doubt partially translate to initial sensorial properties. Electrolyte levels and pH impact the rheology of anionic thickeners, such as crosslinked poly(acrylic acid). The pH for optimum thickening is 6–7, and there is a precipitous decrease in bulk viscosity as the pH drops below 5.5. As the pH of the acid mantle of the stratum corneum typically ranges from pH 4–5, local interactions between the mantle and carboxylates may induce slight shifts in the interfacial rheology (19). Further, and perhaps more importantly, electrolyte levels vary from person to person and from season to season (20). Salt melting, which is caused by water-soluble cations interfering with the electrostatic thickening mechanism, profoundly impacts the rheology of anionic thicken- ers. As with pH, the effect on viscosity is localized at the interface, but may become more pronounced as an emulsion is broken down while shearing the product into the skin. Ewoldt and McKinley developed a convention for using Lissajous plots to quantify the transition of a structured material to its fl ow state (21). Using the loop area in an elastic Lissajous plot, where the area relates to energy dissipation, it is possible to follow the gradual cascade of the microstructure and to relate the data to variations in measured stress—which is what the “transducer” of a panelist senses when rubbing a cosmetic for- mulation into the skin. In brief, the energy dissipated in a single oscillation cycle is compared to the maximum energy that can be dissipated in a perfect plastic response (ϕ)—where the maximum dissipated energy is visually described by the smallest rectan- gle (in a σmax vs. γmax plot) that each Lissajous loop can fi t within. The scalar quantity, ϕ, is essentially a 2-D representation of microstructural changes as a function of shear. Like stress, ϕ is sensitive to wall slip and changes at the product–transducer interface, where salt melting occurs. A magnitude of ϕ = 0 represents an elastic response, and ϕ = 0.785

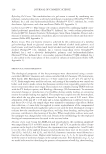
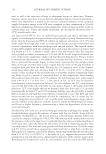
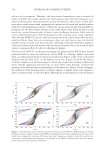
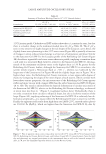
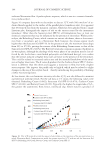
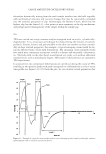
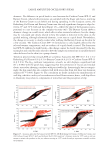
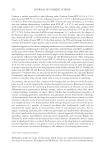
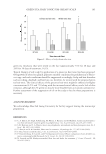
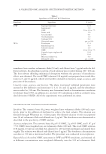
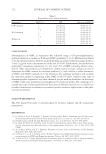
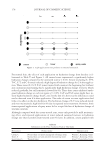
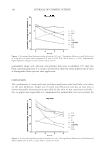
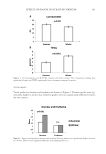
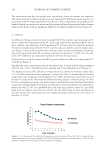
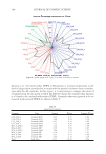
JOURNAL OF COSMETIC SCIENCE 144 indicates Newtonian fl ow. A perfect plastic response, which is rare in a cosmetic formula- tion, produces ϕ = 1. Figure 10 compares data with no electrolyte to data at 32°C with 500 nmol/cm2 of so- dium chloride applied to the surface of the parallel plate (transducer side). It is apparent that σ versus ϕ data from the Lissajous contours, which has been plucked from a single Lissajous plot, distinguish the impact of salt on the stresses sensed by the instrument transducer. Other than the Sunscreen Gel SPF-50, all formulations have at least one chemical component that may be infl uenced by the presence of electrolyte. Without elec- trolyte, the Refreshing Cream, which contains an anionic thickener, shows a slow transi- tion from a viscoelastic gel to a Newtonian fl uid however, the stresses appear much higher than the Sunscreen Gel SPF-50. In the presence of salt, the maximum stress drops from 463 to 279 Pa, putting the stresses of the Refreshing Cream nearer to that of the Sunscreen Gel SPF-50 (242 Pa). The Buttery Cream also contains an anionic thickener in its water phase although the rheology of the water phase of an emulsion may be less af- fected by salt levels than a cross-linked polyacrylic acid thickened hair gel, it is evident that the stresses induced at higher shear rates are lower in the presence of the electrolyte. This could be related to increased surface area and the intended breakdown of the emul- sion at higher shear rates. The σ versus ϕ gradient for the Cushion Cream SPF-15 formu- lation is different than the others and suggests a transition to fl ow, but with a higher stress response. Salt impacts the profi le only at high ϕ, which may be related to slight changes in the size of the acrylate beads—thereby introducing the possibility of forming a lower viscosity slip layer. At low strains, the even harmonic intensity salt data (I2/I1) was also followed to monitor asymmetrical wall-slip trends. For the salt data at 1% strain, the following values were obtained: Refreshing Cream (0.082) Sunscreen Gel SPF-50 (0.070) Cushion Cream SPF-15 (0.043) and Buttery Cream (0.022). Typically, the higher the magnitude of I2/I1, the greater the asymmetric fl ow hence, interfacial slip, which may be a product of Figure 10. Plot of σ versus ϕ to view the impact of electrolyte on the transition of the microstructure to a nearly Newtonian fl uid. Comparisons are made for systems tested at 32°C with no salt for Sunscreen Gel SPF-50, Refreshing Gel Cream, Buttery Cream, and Cushion Cream SPF-15.
Purchased for the exclusive use of nofirst nolast (unknown)
From: SCC Media Library & Resource Center (library.scconline.org)