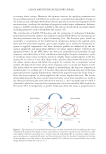
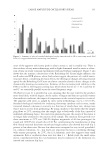
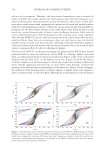
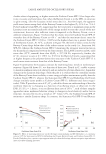
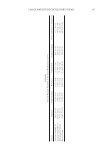
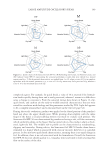
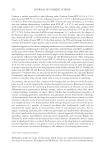
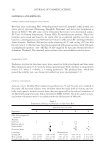
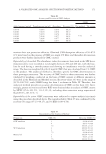
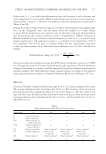
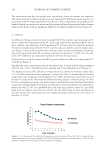
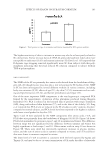
LARGE AMPLITUDE OSCILLATORY SHEAR 137 is less abrupt, and more of a gradual cascade in microstructural strength, experience with visualizing Lissajous trajectories enables a crude determination of yielding via LAOS (denoted as σ0 or σ’0 to differentiate from τ0 from stress ramp data). These guesstimates may then be better confi rmed by correlating critical loop shape changes with extracted G”/G’ (σ0) crossover data. For the 25°C/smooth data shown in Figure 4, the G”/G’ cross- over occurs at 116 Pa, which corresponds to loop 14, where σmax = 116 Pa. A more reli- able method may be to report the peak in σ’ as a function of oscillatory strain (σ’0), where σ’0 = 99 Pa. It should be noted that σ0 and σ’0 calculated in this article are from high- frequency LAOS data and should not be confused with low shear σ0 and σ’0 data from low-frequency experiments, which may better correlate with shear ramp τ0 data and sub- sequent assessment of the at-rest materials properties. Both yield stress results from the dynamic high-shear LAOS data (smooth surfaces) are substantially higher than that determined by standard stress sweeps (i.e., τ0 = 14 Pa), and are indicative of disparities in collective viscoelastic, slip, and shear banding responses while performing high-frequency LAOS experiments. Furthermore, yield stress materials do not obey the Cox–Merz rule hence, oscillatory shear rate values obtained from dynamic experiments will never match those measured in steady state testing. The bending of the loops, and well-defi ned, super- imposed lines between successive iterations at the same strain (compare to Buttery Cream Figure 4C), suggest that the structure breaks quickly and reforms more slowly than the onset of the next strain setting further, iterations at the same shear rate overlay, indicating very little to no thixotropy. The speed of the test to generate the Lissajous plot ( 60 s) and the short delay between each strain increase (2 s) essentially conceal any signifi cant structure rebuilding, which is apparently a longer-time process. Figure 5. Smooth versus rough surface viscous Lissajous overlay (ω = 50 rad/s) to emphasize the low oscilla- tory shear rate region for (A) Sunscreen Gel SPF-50, (B) Refreshing Gel Cream, (C) Buttery Cream, and (D) Cushion Cream SPF-15.

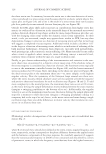
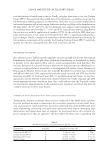
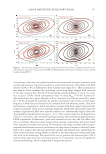
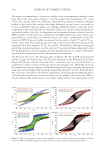
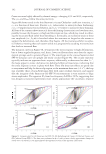
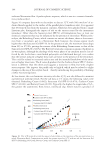
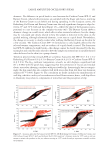
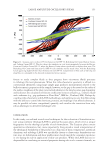
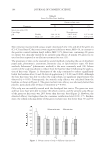
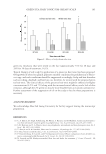
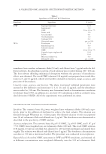
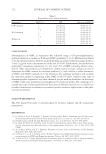
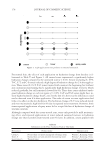
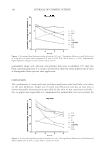
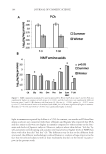
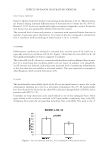
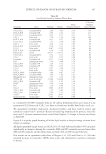
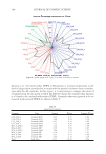
JOURNAL OF COSMETIC SCIENCE 138 The impact of temperature is a factor to consider as the jar temperature normally varies from that of the skin surface. Figures 3 and 6A suggest that temperature (25° versus 32°C) only slightly affects the high-rate, shear-thinning behavior however, although hidden in the scale of the overlay, this slight difference in total stress is accessible in G’L/G’M, Chebyshev elasticity index (e3/e1) and σmax (Table II). Figure 7 maps the elastic component of the total stress (σ’) as a function of shear rate. At the chosen isotherms us- ing smooth surfaces, the effect of temperature on the apparent dynamic elasticity near the LVR is notable, but the difference is minimal at the highest shear rates, where mid-to-late spreadability is rated hence, for smooth surfaces, the elastic contributions to the Sun- screen Gel SPF-50 sensory profi le are expected to be similar at both 25° and 32°C iso- therms. Note that shear banding and wall slip confound the physical meaning of the magnitude of σ and, therefore, σ’, σ”, σ0, and σ’0. Nevertheless, wall slip is an integral part of the sensorial experience, and the apparent σ’ is potentially more important to tex- ture profi ling than accurately gauging the true material property (i.e., slip or shear band- ing clouds the interpretation of the instrumental stress response). The Refreshing Gel Cream. The Lissajous plots in Figures 4B, 5B, and 6B summarize the smooth, rough, and thermal data. The Lissajous trajectory of the Refreshing Gel Cream (Figure 4B) shows a smooth transition from a viscoelastic gel to a structured fl uid, as judged by its nearly circular center loops and its thin Lissajous tail. Thermally speaking, the standard rheology (see Figure 3) of the Refreshing Gel Cream, including the apparent yield stress, was not affected by raising the temperature from 25° to 32°C however, there was a decrease in the ZSV at the warmer temperature, indicating that the fl ow and associ- ated molecular interactions at near-zero shear rate are slightly affected by heat. This is echoed in Figure 6B, which shows a very slight change (earlier stress plateauing) in the Figure 6. Effect of temperature and/or surface roughness on the contours of the shear rate plots for (A) Sun- screen Gel SPF-50, (B) Refreshing Gel Cream, (C) Buttery Cream, and (D) Cushion Cream SPF-15.
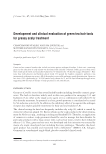
Purchased for the exclusive use of nofirst nolast (unknown)
From: SCC Media Library & Resource Center (library.scconline.org)