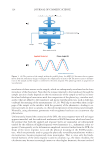
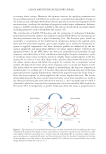
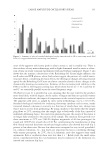
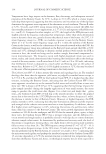
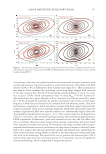
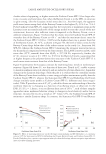
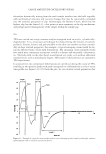
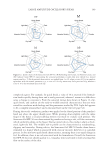
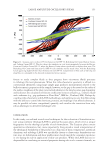
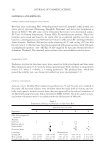
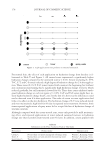
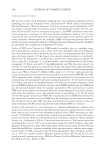
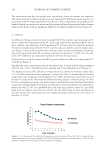
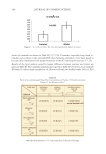
LARGE AMPLITUDE OSCILLATORY SHEAR 123 lels (8,11). Prior work also included sensorial correlations with discrete Fourier transform (DFT) and Chebyshev polynomials derived from LAOS experiments correlations included initial spreading, pick up, and cushion for a series of anionic hydrogels (12). In the current study, SAOS and fl ow methodologies were performed on texture proto- types to better understand the impact of viscosity, frequency, yield stress, thixotropy, and nonlaminar fl ow on the shapes of the Lissajous plots however, the principal objective of this work was to investigate the parallels between sensorial texture ratings and the trajec- tories of the Lissajous loops as a sample is deformed rotationally from the linear viscoelas- tic region (LVR) to large strains and high oscillatory shear rates using dynamic strain sweep experiments. Within the LVR, the loop trajectory mostly represents the at-rest state, whereas at very high strains, the Lissajous fi gures present a transition to a fl owing structured fl uid. Manipulating the resultant nonlinear Lissajous data enables decomposi- tion of the data into additional descriptive parameters. For example, performing DFT on the data subsequently enables conversion of the time-based (or temporal) stress response to the frequency domain. The population of each harmonic term in the frequency distri- bution is, hence, derived from the nonlinear stress-wave shape. The insights provided by this decomposition are refl ected in the introduction of additional Lissajous curves that track the trajectory of the elastic component of stress as a function of strain or shear rate. Thus, a formulator may better understand how the component of stored energy (or the energetic wish to fi ght back against the will of the forced rotation) infl uences the magni- tude of the total stress and the quality of the sensorial experience. SAOS TO LAOS AND THE RESULTING LISSAJOUS PLOTS Traditional dynamic oscillatory shear testing (SAOS) is conventionally applied to materi- als to determine a material’s at-rest microstructural properties, such as the magnitudes of the frequency-dependent elastic modulus [G’(ω)], loss modulus [G”(ω)], complex viscos- ity [η*(ω)], and tan delta [tan δ(ω)]. SAOS properties are studied in the LVR, where the driving forces that restore the structure stem from thermal energy (i.e., Brownian motion). In traditional oscillatory testing using a strain-controlled rheometer, a sinusoidal shear- ing strain is applied to the sample, and the sinusoidal stress response is simultaneously measured with the torque transducer (see wave interaction in Figure 1). Elastic samples exhibit no shift in phase (δ) between the applied strain and the measured stress response, whereas viscous samples have a phase shift of 90°. Viscoelastic materials, which comprise both viscous and elastic properties, exhibit phase shifts ranging from 0° to 90° between the absolute value of the stress (σ) and strain (γ) maxima. Imagine 45°–90° to be a visco- elastic liquid (G’ G”), where 45° is a 1:1 balance of elastic and viscous stress (G’ = G”), and 0°–45° to be a viscoelastic solid (G’ G”). For clarity, note that the term “sinusoidal” refers to the shape of the wave that is obtained by plotting strain as a function of time (t) in the following parametric equation: ( ) γ γ ωt(1),) 0 = sin( t where ω is the angular frequency (in rad/s) of the applied strain. Figure 1 implies the interplay between the applied strain, which is imparted by an oscillating motor, and the

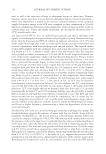
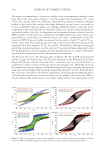
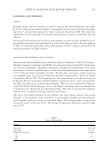
JOURNAL OF COSMETIC SCIENCE 124 translation of these stresses to the sample, which are subsequently transferred to the force transducer of the rheometer. Note that the torque imparted to the transducer through the sample junction clearly depends on the microstructure of the sample as well as its inter- facial and tribological association with the composition of the plates (e.g., stainless steel, acrylic) that are affi xed to the transducer and motor. Interfacial factors, such as wall slip, confound the meaning of the measurements (13,14). Wall slip occurs when there is slip- page of the sample at the interface with the geometry of the rheometer—leading to er- roneous results or, more accurately, to a fl awed interpretation of microstructural strength. Normally, using rheometer geometries with roughened surfaces can circumvent slip phenomena. Unfortunately, beyond the constraints of the LVR, the stress response wave will no longer appear sinusoidal, and the traditional mathematical SAOS functions, which are based on the premise that both the applied and response waves are sinusoidal, are subsequently tainted by the addition of higher frequency wave harmonics (i.e., anharmonic stress re- sponse). Consequently, as the deformation amplitude traverses further from the LVR, the shape of the stress response wave and the physical meaning of the SAOS parame- ters, which are primarily used to gauge the physically reversible perturbations within a microstructure, become progressively more meaningless. That is, since only the funda- mental harmonic of the stress response is used to calculate, e.g., the elastic modulus, the calculation may become increasingly inexact as other higher harmonics become involved Figure 1. (A) The position of the sample within the parallel plates. An ARES G2 rheometer has a separate motor from the transducer design to mitigate the complexities of inertia. (B) The motor exerts a deforma- tion on the sample and the torque is converted to the stress response. The phase lag relates to properties of viscoelasticity.
Purchased for the exclusive use of nofirst nolast (unknown)
From: SCC Media Library & Resource Center (library.scconline.org)