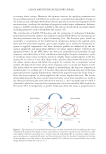
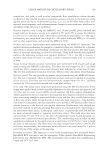
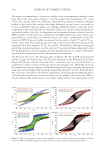
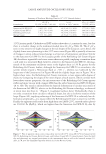
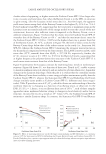
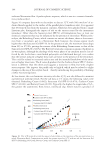
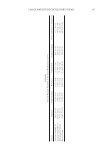
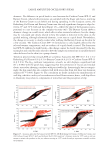
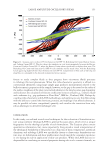
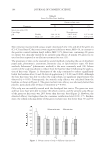
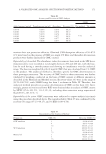
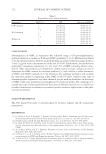
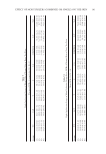
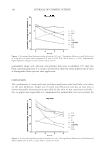
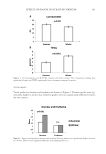
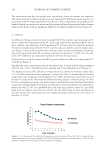
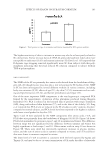
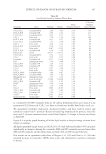
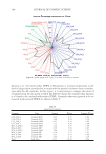
LARGE AMPLITUDE OSCILLATORY SHEAR 141 clarifi es what is happening at higher strains the Cushion Cream SPF-15 has larger elas- ticity, viscosity, and total stress but, when the Buttery Cream is in the LVR, its structure is quite strong. Like the Lissajous initial stress data (i.e., fi rst few loops), the apparent yield stress (stress sweep data) of the Buttery Cream is also higher (τ0: 92 ± 6 vs. 76 ± 4 Pa for Cushion Cream SPF-15), suggesting that the total stress at maximum strain in the Lissajous is not necessarily indicative of the energy needed to start the cascade of the mi- crostructure however, after suffi cient strain is imparted to the Buttery Cream, even at ambient temperature, Figure 7A shows that the elastic stress for Cushion Cream SPF-15 overtakes that of the Buttery Cream at 50 s-1 and that the maximum elastic stress for the Cushion Cream SPF-15 (509 vs. 358 Pa) at the highest shear rate is greater than that of the Buttery Cream. At 32°C, as shown in Figure 7B, the level of elastic stress for the Buttery Cream drops below that of the softest texture in the study (i.e., Sunscreen Gel SPF-50), whereas the Cushion Cream SPF-15 maintains the strongest microstructure in the hierarchical comparison between the four textures. The LAOS crossover and σ’0 yield stress data (25°C, smooth) show that σ0/σ’0 = 457/338 Pa, respectively further, the G”/G’ crossover occurs at γ = 138% (vs. 9.9% for the Buttery Cream), suggesting that at higher frequency the polymer-driven fi ne structure of the Cushion Cream SPF-15 is much more strain resistant than that of the Buttery Cream. Figure 8 summarizes the Lissajous contours by examining basic trends in nonlinear pa- rameters. Figure 8A shows G’L as a function of shear rate. Trends in G’L enable a means to monitor nonlinear intracycle elasticity, and are indicative of strain (shear rate)–dependent changes in the Lissajous loop shape. From the plot it is evident that the crystalline matrix of the Buttery Cream loses its ability to store energy at higher strains more quickly than the Cushion Cream SPF-15 whereas the Sunscreen Gel SPF-50 and Refreshing Gel Cream change similarly (same profi le as Cushion Cream SPF-15, different total stress magni- tudes). Table II provides a ratio of G’L/G’M, which facilitates an understanding of how the nonlinear elasticity is changing as a function of oscillating strain, or shear rate. In the LVR, G’L/G’M = 1 hence, at an oscillatory shear rate of 185 s-1, each of these samples approaches more nonlinear behavior owing to changes in local elasticity and/or loss in structure. As noted by G’L/G’M trends at 25° versus 32°C, the Cushion Cream SPF-15 maintains a similar Lissajous shape. In contrast, the Sunscreen Gel SPF-50 and Buttery Figure 8. Effect of increasing shear rate on the (A) large strain modulus and (B) Chebyshev v3/v1 intensity ratios at 32°C for Sunscreen Gel SPF-50, Refreshing Gel Cream, Buttery Cream, and Cushion Cream SPF-15. For the Chebyshev plot, a positive sign suggests intracycle shear thickening, whereas a negative sign indicates intracycle shear thinning processes.

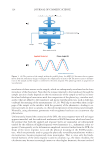
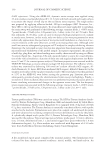
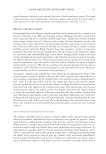
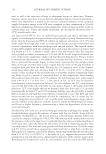
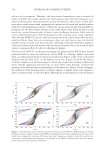
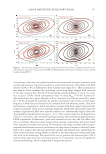
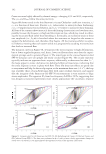
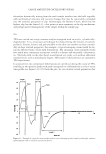
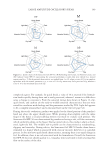
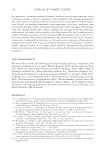
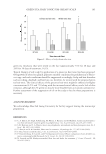
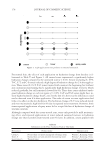
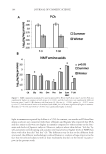
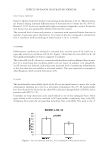
JOURNAL OF COSMETIC SCIENCE 142 Cream are more highly affected by thermal energy—changing 43% and 40%, respectively. The e3/e1 and σ’max follow the same proclivity. Figure 8B shows trends in the third harmonic viscous Chebyshev coeffi cient intensity, v3/ v1, as a function of shear rate. Positive v3/v1 values relate to intracycle shear thickening v3/v1 = 0 implies linear viscous behavior, and v3/v1 0 relates to intracycle shear thinning. All four of the textures show intracycle shear thickening characteristics at low shear rates, possibly because the frequency is high and the strains are low, which may result in vibrat- ing the structured fl uid rather than shredding it. Eventually, an oscillation strain or shear rate amplitude (i.e., λ0⋅ω) is breached where the structure no longer has the means to support the deformation, and, therefore, fl ow begins. All four textures exhibit viscoplas- tic behavior, meaning that each system yields to a progressively cascading microstructure that leads to increased fl ow. The Lissajous curves in Figure 9A–D represent the stress response to high deformation, but at lower angular frequency, and, hence, lower oscillatory shear rates than the experi- mental settings used to generate Figure 4. The inner loops in the viscous Sunscreen Gel SPF-50 Lissajous curve are upright and nearly circular (Figure 9A). The circular trajectory typically indicates an apparent elastic response additionally, at shear rates less than 1 s-1, the loops appear to rotate clockwise into deformed elliptical trajectories, indicating that the stress response is more in phase with fl ow. These low shear rate effects are partly due to very minor wall slip. In the no-slip region, at the maximum shear rate (~4 s-1), the loop tips resemble those of near-Newtonian fl ow with some residual elasticity, and suggest that the integrity of the Sunscreen Gel-SPF-50 microstructure is very sensitive to large strain amplitudes. The apparent σ’0 from low-frequency LAOS is 29 Pa, suggesting that low-frequency transient experiments more closely approximate the viscoelastic response Figure 9. Lissajous plots for (A) Sunscreen Gel SPF-50, (B) Refreshing Gel Cream, (C) Buttery Cream, and (D) Cushion Cream SPF-15. The data were performed at ω = 1 rad/s to more closely approximate changes in steady-state viscoelasticity. σ0 approximates the apparent location of the apparent yield stress.
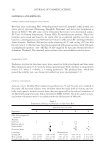
Purchased for the exclusive use of nofirst nolast (unknown)
From: SCC Media Library & Resource Center (library.scconline.org)