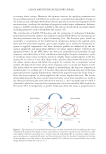
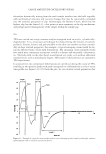
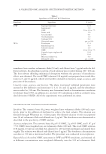
LARGE AMPLITUDE OSCILLATORY SHEAR 127 are proportioned with the fundamental harmonic to best fi t the shape of the deformed wave. The odd harmonics are then extracted, and the resultant frequency data are subsequently recasted into nonlinear parameters—instead of just G’, G”, tan δ, etc.—as a function of the originally applied strain magnitude (or shear rate). The nonlinear materials properties include nonlinear elastic moduli (G’L and G’M), the strain-stiffening ratio (S), and the shear-thickening ratio (T). G’L is a measure of the elasticity at large strains, whereas G’M is the residual elasticity of a material as it fl ows at the highest oscillatory shear rate. Consequently, the nonlinear coeffi cients facilitate a more com- plete description of the local or instantaneous stress response during the sweep of a single oscillation, whereas traditional rheology focuses on the average stress response to the deformation. As sensorial processes are dynamic, it can be argued that panelists sense the most extreme relative rheological transitions, and that an understanding of the divergence in nonlinear parameters is critical to successfully garnering correlations. Finally, from the isolated odd harmonics, the total stress (σ) can be subsequently recasted as temporal data and separated into its elastic (σ‘) and viscous (σ”) compo- nents. Using an application of orthogonal Chebyshev polynomials, Ewoldt and McKinley pro- vide a means for the physical interpretation of a nonlinear stress response, with a means to methodically characterize nonlinear elastic (en) and viscous (vn) parameters (where n = 1st, 2nd, 3rd, etc., harmonic intensities). The result nets the Chebyshev intracycle, or local, viscous, and elastic coeffi cients, where e3 = 0 and v3 = 0 in the LVR further e3 0 implies strain softening, e3 0 indicates strain stiffening, v3 1 describes shear thinning, and v3 0 corresponds to shear thickening (16). In addition, the coeffi cients also enable a direct mathematical connection between the Chebyshev and Fourier nonlinear param- eters, thereby giving physical meaning to the Fourier parameters. Summing up, the in- tracycle coeffi cients represent coeffi cients describing the dynamic, local variations in the dissipative and elastic phenomena as a function of shear rate within an oscillation cycle. MATERIALS AND METHODS In this study, we investigated the rheological behavior of four fi nished formulation proto- types having unique textural properties. SAOS, LAOS, and other rheological data were generated for the four systems. The data obtained from rheology experiments were com- pared to textural data obtained by texture profi le analysis. The validity of the instrumen- tal techniques to accurately describe specifi c texture characteristics for each formula was challenged by sensorial analysis. FORMULATIONS Four distinct formulation systems were evaluated in this study, namely an alcohol-based sunscreen gel, a gel cream, an o/w SPF-15 cream, and an o/w emulsion with a higher wax phase. Sunscreen Gel SPF-50. The product is created by gelling sunscreen fi lters, light esters (Ceraphyl™ Ashland, Inc., Covington, KY), and alcohol with lightly crosslinked poly(vinyl pyrrolidone) (FlexiThix™ Ashland, Inc.) (Table AI, Appendix 1).

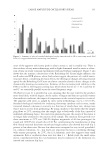
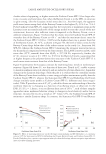
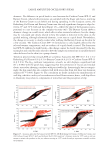
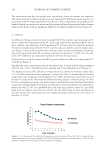
JOURNAL OF COSMETIC SCIENCE 128 Refreshing Gel Cream. This emulsifi er-free o/w gel cream is created by combining two polymers, namely poly(acrylic acid/vinyl pyrrolidone) crosspolymer (UltraThix™ P-100 Ashland, Inc.) and cetyl hydroxyethylcellulose (PolySurf™ CS 67 Ashland, Inc.) with shea butter, light esters, and a few emollients (Table AII, Appendix 1). Cushion Cream SPF-15. This bouncy o/w cream is achieved by combining lightly cross- linked poly(vinyl pyrrolidone) (FlexiThix™ Ashland, Inc.) with sodium polyacrylate (Covacryl MV 60 Sensient Cosmetic Technologies, Saint-Ouen-l’Aumône, France) and a mixture of nonionic and anionic emulsifi ers, plus several ultraviolet fi lters and skin mois- turizers (Table AIII, Appendix 1). Buttery Cream. This o/w buttery texture is achieved by the combination of a lamellar gel technology based on glyceryl stearate (and) behenyl alcohol (and) palmitic acid (and) stearic acid (and) lecithin (and) lauryl alcohol (and) myristyl alcohol (and) cetyl alcohol (Prolipid™ 141 Ashland, Inc.), various long-chain esters (Ceraphyl™ Ashland, Inc.), and a relatively hydrophobic polymer, cetyl hydroxyethylcellulose (Natrosol™ Plus Ashland, Inc.). A secondary polymer (Stabileze™ QM Ashland, Inc.) is also added to the water phase of this cream for enhanced stabilization (Table AIV, Appendix 1). RHEOLOGICAL CHARACTERIZATION The rheological properties of the four prototypes were characterized using a strain- controlled ARES-G2 rheometer and a stress-controlled AR-G2 rheometer (TA Instruments, New Castle, DE). Rheological tests (n = 3) were carried out at 25° ± 0.1°C and 32° ± 0.1°C. Fresh samples were used for each test, and zeroing of the transducers was carried out before each trial to make certain that Lissajous overlays were repeatedly centered at the stress versus strain (shear rate) origin. Data analysis was completed using TRIOS software with the FT Analysis option, and Rheology Advantage (TA Instruments). To minimize structural changes or introduction of air bubbles during sample loading, an unvarying routine for sample loading was applied. The sample was scooped onto the bottom plate, after which the top plate was slowly lowered to the gap at a rate of 0.05 mm/s. After adjustment of the gap (H = 1.00 mm) and a 2-min equilibration to alleviate excess nor- mal forces (Nf 10 g), the sample edges were trimmed to minimize edge effects. Before data collection, a 3-min delay was applied to ensure replenishment of the compromised structure. Both smooth and rough plate surfaces were used for most rheological testing to evaluate how the contribution of edge effects, wall slip, shear banding, and/or plug-fl ow processes contribute to the meaning of the data. When rough plate surfaces were used, the sandpaper was changed after every trial. Details of the methodology for the employed rheological measurements are discussed in the sections below. Dynamic strain sweep. Using the ARES-G2 and smooth plates, the oscillation amplitude was ramped from 0.1% to 600% strain at both 25° and 32°C to probe the effect of tem- perature on the length of the LVR plateau the experiments were completed at 1 and 50 rad/s to see the effect of the applied frequency (and oscillation shear rate) on the results. The 2nd (I2/I1), 3rd (I3/I1), 4th (I4/I1), and 5th (I5/I1) harmonic intensities were followed as a function of oscillation strain. Higher order harmonics (e.g., I2, I3, I4, I5) typically appear with the onset of nonlinear changes in the sample structure. Even harmonics (e.g., I2, I4) are useful indicators for identifying the presence of asymmetrical wall slip, shear banding,
Purchased for the exclusive use of nofirst nolast (unknown)
From: SCC Media Library & Resource Center (library.scconline.org)