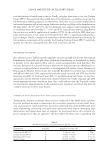
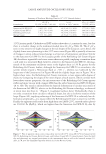
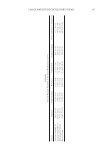
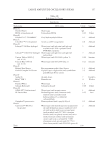
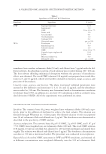
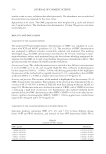
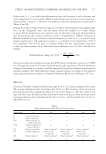
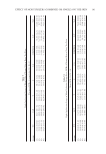
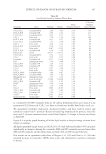
Table III Selected Textural Attributes of the Tested Formulations (25° Texture Firmness Compressibility Resilience Cohesiveness Integrity of shape Elastic resistance to deformation Sunscreen Gel SPF-50 14.25 ± 0.78 0.79 ± 0.04 0.12 ± 0.01 23.57 ± 1.58 0.87 ± 0.02 11.27 ± 1.13 Cushion Cream SPF-15 105.25 ± 6.01 0.84 ± 0.01 0.18 ± 0.01 122.98 ± 12.62 0.85 ± 0.01 88.72±3.98 Refreshing Gel Cream 39.75 ± 2.47 0.76 ± 0.00 0.15 ± 0.02 73.74 ± 7.45 0.79 ± 0.01 30.14 ± 1.95 Buttery Cream 127.85 ± 14.92 0.70 ± 0.00 0.08 ± 0.01 214.24 ± 18.44 0.90 ± 0.01 89.58 ± 10.26 LARGE AMPLITUDE OSCILLATORY SHEAR 147

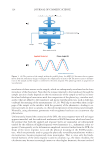
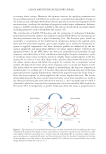
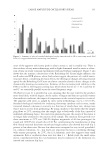
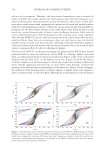
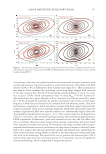
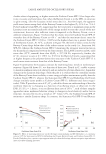
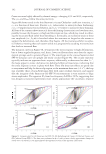
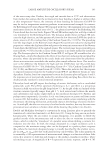
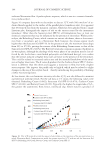
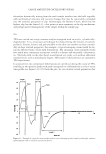
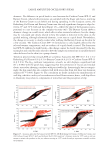
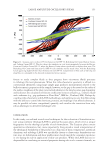
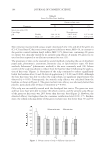
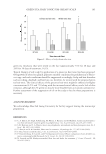
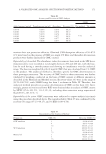
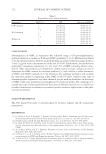
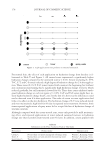
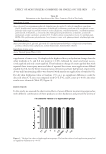
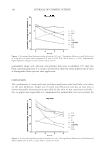
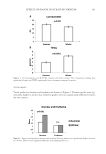
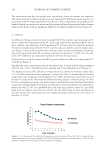
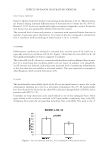
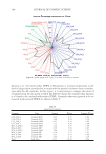
JOURNAL OF COSMETIC SCIENCE 148 measurements, relates to increasing nonlinearity essentially, the Buttery Cream and Cushion Cream SPF-15 are more cohesive than the Refreshing Gel Cream and Sunscreen Gel SPF-50 technology, and the outcome may be interconnected with greater retained elasticity (at 25°C, 185 s-1). Moreover, there is also a linear correlation (R2 = 0.967) between σ’-LVR, which is the elastic stress isolated from the LVR, and TPA cohesiveness. The result implies that work energy derived from low frequency probe oscillations in TPA may best relate to linear deformation outcomes in LAOS. Another trend to note is that there is a logarithmic correlation (R2 = 0.997) between Brookfi eld viscosity and cohesiveness—hence, both TPA and Brookfi eld viscosity measurements with a T-spindle may have negligible (or similar) sensitivity to wall slip. The integrity of shape data—also reported in Table III—do not conform to basic rheo- logical parameters but depend on the complex interactions of the product with itself and with the acrylic texture analyzer probe. The Buttery Cream has the highest values in this category followed by the Sunscreen Gel SPF-50, Cushion Cream SPF-15, and Refreshing Gel Cream. The elastic resistance to deformation seems to follow a trend related to the consistency of the sample that refl ects the same trends observed for fi rmness and cohesive- ness. This could be related to the original LAOS plots shown in Figure 4 by examining the maximum stress encountered at prescribed strains however, this term is probably complex and depends on a number of physical factors of the formula. In addition, comparing the instantaneous elasticity results from stress growth experi- ments obtained with the rough and smooth surfaces (Summary of Standard Rheology Data section) with the cohesiveness data from the TPA experiments, we fi nd that the absolute differences follow the same trend as the cohesiveness data obtained from the TPA. For example, in the stress growth experiment, the following mathematical differ- ences between rough and smooth surfaces are obtained: Sunscreen Gel SPF-50 (33 Pa), Refreshing Gel Cream (33 Pa), Cushion Cream SPF-15 (64 Pa), and Buttery Cream (554 Pa). As already stated, mathematical differences in the stress growth data more than likely indicate wall slip and refl ect trends in interfacial properties as well as cohesiveness. One should bear in mind that while similarities in trends may be observed between stan- dard rheology tests and TPA, fundamentally, the mechanical deformation is distinct. In TPA, we investigated the texture of the formula during pickup from the packaging, since this technique is conducted in the z-direction, and with relatively low probe velocity, without consideration of shear forces. Nonlinear, high shear rate rheological techniques, on the other hand, provide better insight into the rub-out behavior of product, and are more accurately captured by LAOS techniques. Furthermore, the reported TPA experi- ments were conducted at 25°C hence, using the generated TPA data to emulate the performance of the Buttery Cream on the skin (32°–35°C) is not entirely feasible. SENSORIAL ANALYSIS A fi ve-membered expert panel carried out the sensorial analysis. Principally, they judged the initial, middle, and fi nal rub-in profi les for each product and provided rankings for quick break, tack, cushion, slip, dry feel, quick absorption, and light feel. In addition, the expert panel provided a sensorial description of each formulation, which is also described in this section. Figure 12 depicts the sensorial evaluations for the four formulations. Rat- ings are from 1 to 10, where a value of 1 disagrees with the named characteristic while 10
Purchased for the exclusive use of nofirst nolast (unknown)
From: SCC Media Library & Resource Center (library.scconline.org)