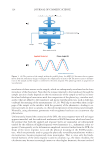
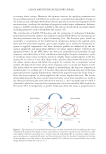
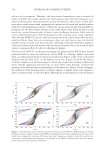
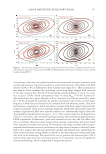
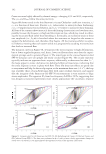
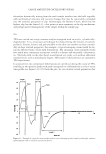
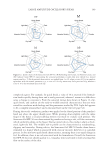
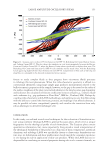
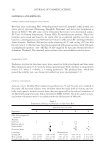
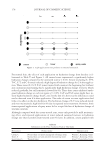
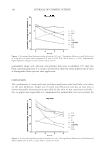
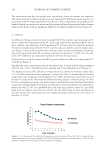
LARGE AMPLITUDE OSCILLATORY SHEAR 125 in storing elastic energy. Moreover, the primary motives for applying nondestructive forces and deformations in SAOS are to study time- or temperature-dependent changes in the material and, although the Hookean domain provides a mechanical fi ngerprint of the microstructure, studying the rheological properties under larger, anharmonic deforma- tions (i.e., LAOS) correlates more suitably to the end use of structured viscoelastic fl uids, including properties such as breakdown and texture (15). The introduction of LAOS, FT-rheology and the utilization of orthogonal Chebyshev polynomials potentially address and augment standard SAOS theory by introducing ad- ditional parameters that have a physical meaning (16). The Lissajous plots, which are essentially a visualization of the mathematical interference between the applied strain wave and the stress wave response, give visual insights into a material’s mechanical re- sponse to applied temperature and shear. Lissajous profi les are infl uenced by the fre- quency, amplitude, and initial phase difference (see phase angle in Figure 1) between the superposed waves. In the LVR, where the waves are sinusoidal and essentially of equal frequency, and where there is little contribution from higher frequency harmonics, a plot of oscillatory stress versus oscillatory strain for a highly elastic sample appears in the Lis- sajous plot as a line or a very thin ellipse with a positive slope (where the minor axis of the ellipse centers above and below the origin). In contrast, for a completely viscous sample, the shape of the stress versus strain Lissajous curve is circular (see Figure 2). Ide- ally, unless there are issues with the sample or methodology, the loops are symmetrical around strain = 0, or shear rate = 0, because the positive Cartesian trajectory of the loop represents positive angular displacement, whereas the negative trajectory of the loop re- fl ects the stress response to strain applied in the reverse angular direction. The inverse relationship between the stress versus strain and stress versus shear rate plots is a result of the shear rate (γ) being the time derivative of strain [i.e., γ(t) = γ0sin(ωt) and γ = dγ/dt = γ0ωcos(ωt), where the cosine and sine trigonometric functions naturally differ in phase by π/2 rad or 90°]. Consequently, in perfect Newtonian fl ow, the stress is proportional to Figure 2. The transition of a strain-based Lissajous plot to a shear rate–based trajectory infl uences the visual meaning of the diagram. If a sample is elastic, a plot of stress versus strain results in a line (A) however, if the same sample is plotted versus shear rate, a circular trajectory will emerge (B). A viscoelastic sample will ap- pear as an ellipse as it contains both elastic and viscous character. Note: In the elastic Lissajous plot, the slope of the semimajor axis of the ellipse is the complex modulus (G*), and the area is proportional to the average energy dissipated within the cycle (i.e., G”).

JOURNAL OF COSMETIC SCIENCE 126 the shear strain rate. In summary, because the strain rate is the time derivative of strain, a line is produced in a stress versus strain Lissajous plot for an elastic sample (elastic Lis- sajous plot, see Figure 2A), and a line is the result of a stress versus shear rate Lissajous plot for a perfectly viscous material (viscous Lissajous plot, see Figure 2B). Outside the LVR, phase shifts and/or increases in contributions from higher stress har- monics (as evidenced by a distortion in the sinusoidal shape of the measured stress wave) produce distorted-elliptical loop shapes within the many-looped Lissajous plot that vary with the changing strain steps within the dynamic strain sweep experiment. In other words, a soft, yet structured, sample may appear elastic within its LVR, but may then demonstrate changes in structure as a function of increasing strain such that its last loop will suggest a completely viscous response. Additional trends include a clockwise “tilt” in the loops as a function of increasing strain, which is an indication of softening of the bulk material furthermore, deviations from ellipticity, especially with upward/down- ward pointing tips, refl ect intracycle strain stiffening (16). Many materials become stiffer when a stress is applied—where intracycle strain stiffening conveys a material’s local, nonlinear elastic response within the span of a single oscillation step. Finally, to get a better understanding of the instrumentation and variation in the tran- sient shear rates encountered in a dynamic strain sweep step, if the absolute value of the stress response is considered as a function of strain, the maximum stress typically occurs at the maximum controlled strain (see Figure 2A), and the lowest measured stress is produced at 0% strain. Now, switching to the shear rate plot (see Figure 2B), the shear stress peaks at the maximum shear rate—or, more simply, at the highest angular velocity. Note the symmetry of the Lissajous loops around zero shear rate, where the stress maxima (think absolute value) are encountered at both the negative and positive shear rate boundaries for each oscillation step (Figures 1B and 2). To add more complexity to the mental picture, the maximum shear rate occurs at 0% strain, as the motor driving the sample deformation moves midway between the strain maxima (imagine a swinging pendulum at the bottom of its arc). Additionally, the angular velocity is zero at the maximum strain because the motor driving the sample physically stops for a moment to shift directions (imagine a swinging pendulum coming to a temporary halt at the top of its arc) hence, as the motor twists and turns during a single oscillation step, there are subtle differences in motor velocity that translate into vari- ations in oscillatory shear rate. DFT AND CHEBYSHEV POLYNOMIALS FT-rheology involves decomposition of the raw stress response into its individual har- monics (Eq. 2). ( )= σ ω γ σ ω φ σ ω φ σ ω 1 1 1 3 1 3 5 1 , sin + + sin 3 + + sin 5 +φ5)+! ( ) ( ) ( t t t (2), where σ, γ, ω, and t have already been defi ned as the stress, strain, angular frequency, and time, respectively, and φi corresponds to the phase difference between the applied strain and the harmonic components of the stress response. In a nutshell, equation (2) suggests that the nonsinusoidal response in LAOS is best contained and described by a series of parametric terms in which the frequency contributions from the higher harmonics
Purchased for the exclusive use of nofirst nolast (unknown)
From: SCC Media Library & Resource Center (library.scconline.org)