161 Hydrolyzed Conchiolin Protein Inhibits Melanin
incubated with the primary antibodies of anti-Rab27A (Abcam, Cambridge, UK), anti-
Rac1 (Abcam, Cambridge, UK), anti-MITF (Cell Signaling Technology, Massachusetts,
USA), anti-β-Catenin (Cell Signaling Technology, Massachusetts, USA), anti-phospho-
GSK-3 β (Cell Signaling Technology, Massachusetts, USA) and anti-tyrosinase (Abcam,
Cambridge, UK) at 4°C overnight and then were incubated with the fluorescently labeled
secondary antibody for 2 hours at room temperature. The protein bands were visualized
by the fluorescent Western blot imaging systems (LI-COR Biosciences, Nebraska, USA).
MEASUREMENT FOR MELANIN SECRETION AND TYR ACTIVITY ASSAY
MelanA cells were maintained in phenol red-free DMEM (Gibco, Massachusetts, USA)
that contains 104 mg/L L-Tyrosine disodium salt dehydrate, pretreated with 20 nM ET-1
for 24 hours and then treated with HCP of 1 µg/ml and 10 µg/ml for 24 hours. Phenol
red-free DMEM without HCP served as a control. Extracellular melanin in the medium
secreted by MelanA cells was measured at 490 nm.
MelanA cells were pretreated with 20 nM ET-1 for 24 hours, then treated with different
concentrations of HCP for 24 hours. Cells were lysed with 1% Triton X-100 at -80°C for
30 min in 24-well plates. Cell extracts were centrifuged at 12,000 rpm for 10 minutes
at 4°C, and the supernatants were used for TYR activity assay, where 100 µL of 4 mM
L–Dopa and the test supernatants were incubated in a 96-well plate for 1 hour at 37°C.
Colorimetric measurement was performed at 490 nm.
STATISTICAL ANALYSIS
Statistical analysis of results was performed using one-way analysis of variance (ANOVA)
with Tukey’s correction for multiple comparisons. All data were analyzed using GraphPad
Prism software (GraphPad, California, USA). Values were given as mean ± SD. *P 0.05,
**P 0.01, and ***P 0.001 were considered significant.
RESULTS
HCP EXHIBITS LOW TOXICITY TO PIG1 AND MELANA CELLS
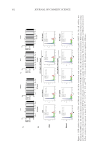
To investigate the effects of HCP on melanin transfer in PIG1 and MelanA cells, we first
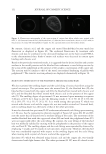
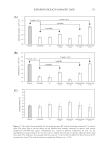
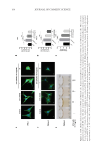
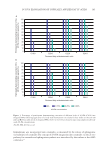
confirmed the safety of HCP on these two types of cells using MTS assay. As shown in
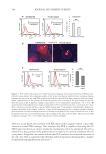
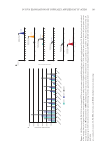
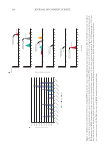
Figure 1A, no marked cytotoxic effects of HCP were observed even at the concentration of
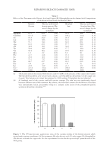
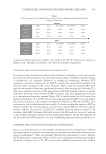
10 µg/ml in PIG1 and MelanA cells. In addition, we performed flow cytometry to further
detect the effects of HCP on cell cycle. As expected, HCP treatments at the concentrations
of 1 µg/ml and 10 µg/ml did not alter cell cycle progression of MelanA and PIG1 cells
(Figure 1B, Table I). These results together indicate that HCP was safe for MelanA and
PIG1 cells.
Given that soluble pearl extract has been shown to lighten the skin by antagonizing
endothelin, it is reasonable to hypothesize that HCP, as a crucial active component of pearl
extract, may exert its effects by inhibiting endothelin. Thus, we also detected the safe
concentration of ET-1 in.MelanA and PIG1 cells. As shown in Figure 1C, 0–60 nM ET-1
incubated with the primary antibodies of anti-Rab27A (Abcam, Cambridge, UK), anti-
Rac1 (Abcam, Cambridge, UK), anti-MITF (Cell Signaling Technology, Massachusetts,
USA), anti-β-Catenin (Cell Signaling Technology, Massachusetts, USA), anti-phospho-
GSK-3 β (Cell Signaling Technology, Massachusetts, USA) and anti-tyrosinase (Abcam,
Cambridge, UK) at 4°C overnight and then were incubated with the fluorescently labeled
secondary antibody for 2 hours at room temperature. The protein bands were visualized
by the fluorescent Western blot imaging systems (LI-COR Biosciences, Nebraska, USA).
MEASUREMENT FOR MELANIN SECRETION AND TYR ACTIVITY ASSAY
MelanA cells were maintained in phenol red-free DMEM (Gibco, Massachusetts, USA)
that contains 104 mg/L L-Tyrosine disodium salt dehydrate, pretreated with 20 nM ET-1
for 24 hours and then treated with HCP of 1 µg/ml and 10 µg/ml for 24 hours. Phenol
red-free DMEM without HCP served as a control. Extracellular melanin in the medium
secreted by MelanA cells was measured at 490 nm.
MelanA cells were pretreated with 20 nM ET-1 for 24 hours, then treated with different
concentrations of HCP for 24 hours. Cells were lysed with 1% Triton X-100 at -80°C for
30 min in 24-well plates. Cell extracts were centrifuged at 12,000 rpm for 10 minutes
at 4°C, and the supernatants were used for TYR activity assay, where 100 µL of 4 mM
L–Dopa and the test supernatants were incubated in a 96-well plate for 1 hour at 37°C.
Colorimetric measurement was performed at 490 nm.
STATISTICAL ANALYSIS
Statistical analysis of results was performed using one-way analysis of variance (ANOVA)
with Tukey’s correction for multiple comparisons. All data were analyzed using GraphPad
Prism software (GraphPad, California, USA). Values were given as mean ± SD. *P 0.05,
**P 0.01, and ***P 0.001 were considered significant.
RESULTS
HCP EXHIBITS LOW TOXICITY TO PIG1 AND MELANA CELLS
To investigate the effects of HCP on melanin transfer in PIG1 and MelanA cells, we first
confirmed the safety of HCP on these two types of cells using MTS assay. As shown in
Figure 1A, no marked cytotoxic effects of HCP were observed even at the concentration of
10 µg/ml in PIG1 and MelanA cells. In addition, we performed flow cytometry to further
detect the effects of HCP on cell cycle. As expected, HCP treatments at the concentrations
of 1 µg/ml and 10 µg/ml did not alter cell cycle progression of MelanA and PIG1 cells
(Figure 1B, Table I). These results together indicate that HCP was safe for MelanA and
PIG1 cells.
Given that soluble pearl extract has been shown to lighten the skin by antagonizing
endothelin, it is reasonable to hypothesize that HCP, as a crucial active component of pearl
extract, may exert its effects by inhibiting endothelin. Thus, we also detected the safe
concentration of ET-1 in.MelanA and PIG1 cells. As shown in Figure 1C, 0–60 nM ET-1