259 CRITICAL FACTORS TO OBTAIN STABLE HIP GEL-IN-OIL EMULSIONS
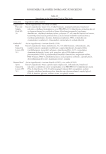
Conductivity measurement. Conductivity measurements were carried out at room temperature
at D1, D7, M1, and M3 using a SevenMulti™ dual pH/conductivity meter (Mettler Toledo
GmbH, Greifensee, Switzerland).
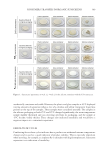
Stability monitoring. The appearance of the formulations was checked after storage at D1,
D7, M1, and M3 in different temperature conditions: room temperature at 45°C using a
BD 400 incubator (Binder GmbH, Tuttlingen, Germany) in −5°C to 40°C freeze–thaw
cycles using an MIR-154 Cooled Incubator (SANYO Electric Co., Ltd., Osaka, Japan), at
−18°C in a BCD-232ESN refrigerator/freezer (Electrolux, Senlis, France).
RHEOLOGY EXPERIMENTS
Experiments were conducted at around 20°C, D7 after manufacturing, using a rotational
controlled stress/strain Discovery Hybrid Rheometer DHR-2® (Waters—TA Instruments,
New Castle, DE, USA). In accordance with the thin particle size of the trials, an anodized
aluminum cone with a diameter of 40 mm, and forming an angle of 2° with the plate, was
selected for all tests.
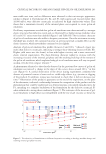
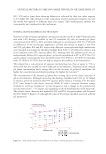
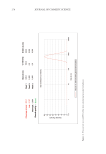
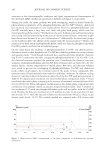
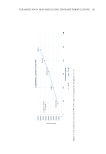
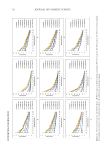
Oscillatory frequency sweeps from 0.1 to 100 rad/s were carried out with an anti-evaporation
cap within the linear viscoelastic domain. Viscoelasticity was then analyzed to evaluate the
level of structuration of the gel-in-oil and its resistance or any change occurring in the
structure during the experiment (frequency expressed in Hz in the Figures according to
international units). Evolution of storage modulus (G’) and calculation of mean G’/G” (i.e.,
loss modulus) ratio were followed to easily compare the formulations. The higher the value
of mean G’ and relative G’/G” ratio, the greater the elasticity and the stronger the structure
of the formulation.
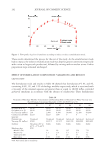
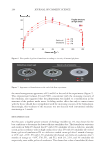
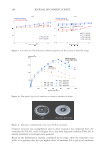
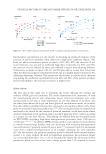
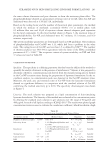
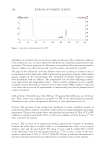
The samples were also subjected to a shear rate ramp ranging from 0 to 1,200 s−1 for 120
seconds (up and down ramp steady state flow protocol) to determine the global flow profile
and yield stress. Curve analysis was performed using the Herschel–Bulkley mathematical
model to extract yield stress and rate index. Rate index, which varies from values close
to zero for a strong shear-thinning profile to one for Newtonian behavior, was used as
an additional indicator to supplement the curves. The purpose of this experiment was
to subject the formulations to greater stress that can be representative of real stressing
situations such as pouring, stirring, mixing, pumping,22,23,24 etc.
IMPACT OF MANUFACTURING PROCEDURE: VARIATIONS AND RESULTS
VARIATIONS ON MANUFACTURING PROCEDURE
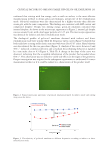
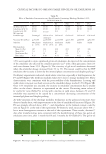
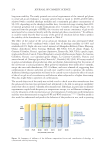
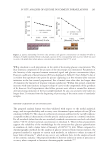
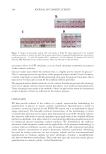
Some parts of the manufacturing process remained fixed for all the trials, according to
conclusions of previous work.17 The gel phase was prepared by dispersing the rheology
modifier (a) in water using a serrated disc stirrer between 500 and 1,000 rpm (IKA
Eurostar 60 digital stirrer, IKA® Works, Guangzhou, China). The antifreeze agent (b) and
preservative (c) were added, and stirring continued until a smooth gel texture was obtained.
The oily phase was prepared by addition of the emulsifier (d) to the oil and manual stirring
for a few seconds with a spatula. Then one phase was introduced into the other, added in
one shot.
Conductivity measurement. Conductivity measurements were carried out at room temperature
at D1, D7, M1, and M3 using a SevenMulti™ dual pH/conductivity meter (Mettler Toledo
GmbH, Greifensee, Switzerland).
Stability monitoring. The appearance of the formulations was checked after storage at D1,
D7, M1, and M3 in different temperature conditions: room temperature at 45°C using a
BD 400 incubator (Binder GmbH, Tuttlingen, Germany) in −5°C to 40°C freeze–thaw
cycles using an MIR-154 Cooled Incubator (SANYO Electric Co., Ltd., Osaka, Japan), at
−18°C in a BCD-232ESN refrigerator/freezer (Electrolux, Senlis, France).
RHEOLOGY EXPERIMENTS
Experiments were conducted at around 20°C, D7 after manufacturing, using a rotational
controlled stress/strain Discovery Hybrid Rheometer DHR-2® (Waters—TA Instruments,
New Castle, DE, USA). In accordance with the thin particle size of the trials, an anodized
aluminum cone with a diameter of 40 mm, and forming an angle of 2° with the plate, was
selected for all tests.
Oscillatory frequency sweeps from 0.1 to 100 rad/s were carried out with an anti-evaporation
cap within the linear viscoelastic domain. Viscoelasticity was then analyzed to evaluate the
level of structuration of the gel-in-oil and its resistance or any change occurring in the
structure during the experiment (frequency expressed in Hz in the Figures according to
international units). Evolution of storage modulus (G’) and calculation of mean G’/G” (i.e.,
loss modulus) ratio were followed to easily compare the formulations. The higher the value
of mean G’ and relative G’/G” ratio, the greater the elasticity and the stronger the structure
of the formulation.
The samples were also subjected to a shear rate ramp ranging from 0 to 1,200 s−1 for 120
seconds (up and down ramp steady state flow protocol) to determine the global flow profile
and yield stress. Curve analysis was performed using the Herschel–Bulkley mathematical
model to extract yield stress and rate index. Rate index, which varies from values close
to zero for a strong shear-thinning profile to one for Newtonian behavior, was used as
an additional indicator to supplement the curves. The purpose of this experiment was
to subject the formulations to greater stress that can be representative of real stressing
situations such as pouring, stirring, mixing, pumping,22,23,24 etc.
IMPACT OF MANUFACTURING PROCEDURE: VARIATIONS AND RESULTS
VARIATIONS ON MANUFACTURING PROCEDURE
Some parts of the manufacturing process remained fixed for all the trials, according to
conclusions of previous work.17 The gel phase was prepared by dispersing the rheology
modifier (a) in water using a serrated disc stirrer between 500 and 1,000 rpm (IKA
Eurostar 60 digital stirrer, IKA® Works, Guangzhou, China). The antifreeze agent (b) and
preservative (c) were added, and stirring continued until a smooth gel texture was obtained.
The oily phase was prepared by addition of the emulsifier (d) to the oil and manual stirring
for a few seconds with a spatula. Then one phase was introduced into the other, added in
one shot.