291 IN SITU ANALYSIS OF GLUCOSE IN COSMETIC FORMULATIONS
MATERIALS AND METHODS
CHEMICALS AND REAGENTS
Glucose monohydrate puriss was provided by Riedel-de Haën. The GOD/POD commercial
kit was from Biosis (Athens, Greece). The working reagent (WR) provided therein contained
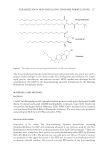
a 0.2 Μ buffer pH 7.1, GOD 18 IU/ml, POD 2 U/ml, 0.25 mM 4-amino phenazone,
10 mM phenol derivative, and relevant cofactors. All cosmetics tested were commercial
products available in the local market by Cosmetic S.A. (Athens, Greece).
APPARATUS
Pictures were taken with a 48-Megapixel camera of a Samsung Galaxy S10, in a portable
white photo studio (PULUZ (China), cube of an edge of 23 cm) equipped with a single
row of LED light (at 3 cm from the edge and parallel to it). An opening exists at the
top center of the cube, where the smartphone camera is positioned. A Brookfield DV-E
digital viscometer was used for viscosity measurements. Conductivity measurements were
performed using a Cond 50 Violab conductivity meter equipped with a conductivity cell
2301T.
PREPARATION OF STANDARDS AND QUALITY CONTROL SAMPLES
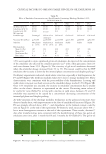
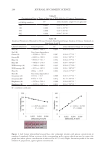
Stocks and quality controls (QCs) of glucose in an O/W emulsion, a shampoo, or a gel,
were freshly prepared by dissolving a suitable amount of glucose monohydrate powder or
of a 1.0% weight per volume (w/v) glucose aqueous solution. Standards and QCs were then
processed as described below.
PROCEDURE FOR QUANTITATIVE DETERMINATION OF GLUCOSE IN AN O/W EMULSION OR GEL
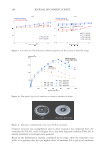
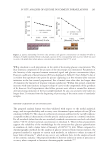
The color-generating reaction was run at 25°C. For this purpose, 1.0 g of a cosmetic
product, containing varying concentrations of glucose, and 642 µL of the WR of the
GOD/POD commercial kit were added into a vial and were thoroughly mixed, manually.
Depending on the emulsion, the addition may have to be performed in aliquots to avoid
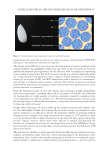
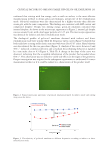
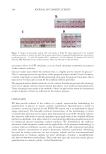
phase separation. The mixture was loaded into the wells of a microstrip, and its surface was
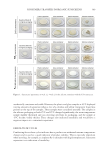
flattened with the flat end of a spatula. Around 5 minutes after reaction initiation and no
longer than 20 minutes after WR addition, a picture of the colored formulation was taken
with a smartphone camera. When dilution was required to lower emulsion glucose levels
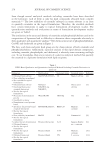
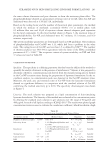
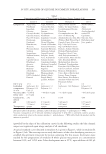
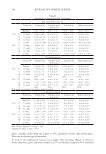
down within the linear range, emulsion B (composition in Table I) was used as the diluent.
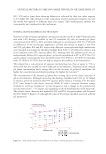
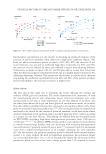
PROCEDURE FOR PICTURE CAPTURING AND ANALYSIS
A 48-megapixel mobile phone camera (lens aperture: F2.0, 1× magnification factor, focal
length (35mm): 25.9 mm, automatic adjustment of brightness) and a white photo studio,
equipped with a single row of LEDs was used for capturing pictures of the cosmetic
samples. The camera was positioned at the opening at the center of the top side of the
MATERIALS AND METHODS
CHEMICALS AND REAGENTS
Glucose monohydrate puriss was provided by Riedel-de Haën. The GOD/POD commercial
kit was from Biosis (Athens, Greece). The working reagent (WR) provided therein contained
a 0.2 Μ buffer pH 7.1, GOD 18 IU/ml, POD 2 U/ml, 0.25 mM 4-amino phenazone,
10 mM phenol derivative, and relevant cofactors. All cosmetics tested were commercial
products available in the local market by Cosmetic S.A. (Athens, Greece).
APPARATUS
Pictures were taken with a 48-Megapixel camera of a Samsung Galaxy S10, in a portable
white photo studio (PULUZ (China), cube of an edge of 23 cm) equipped with a single
row of LED light (at 3 cm from the edge and parallel to it). An opening exists at the
top center of the cube, where the smartphone camera is positioned. A Brookfield DV-E
digital viscometer was used for viscosity measurements. Conductivity measurements were
performed using a Cond 50 Violab conductivity meter equipped with a conductivity cell
2301T.
PREPARATION OF STANDARDS AND QUALITY CONTROL SAMPLES
Stocks and quality controls (QCs) of glucose in an O/W emulsion, a shampoo, or a gel,
were freshly prepared by dissolving a suitable amount of glucose monohydrate powder or
of a 1.0% weight per volume (w/v) glucose aqueous solution. Standards and QCs were then
processed as described below.
PROCEDURE FOR QUANTITATIVE DETERMINATION OF GLUCOSE IN AN O/W EMULSION OR GEL
The color-generating reaction was run at 25°C. For this purpose, 1.0 g of a cosmetic
product, containing varying concentrations of glucose, and 642 µL of the WR of the
GOD/POD commercial kit were added into a vial and were thoroughly mixed, manually.
Depending on the emulsion, the addition may have to be performed in aliquots to avoid
phase separation. The mixture was loaded into the wells of a microstrip, and its surface was
flattened with the flat end of a spatula. Around 5 minutes after reaction initiation and no
longer than 20 minutes after WR addition, a picture of the colored formulation was taken
with a smartphone camera. When dilution was required to lower emulsion glucose levels
down within the linear range, emulsion B (composition in Table I) was used as the diluent.
PROCEDURE FOR PICTURE CAPTURING AND ANALYSIS
A 48-megapixel mobile phone camera (lens aperture: F2.0, 1× magnification factor, focal
length (35mm): 25.9 mm, automatic adjustment of brightness) and a white photo studio,
equipped with a single row of LEDs was used for capturing pictures of the cosmetic
samples. The camera was positioned at the opening at the center of the top side of the