261 CRITICAL FACTORS TO OBTAIN STABLE HIP GEL-IN-OIL EMULSIONS
confirmed that stirring with low energy, such as with an anchor, is the most effective
manufacturing method to obtain gel-in-oil emulsions, irrespective of the emulsification
mode. Gel-in-oil emulsions were also characterized by a higher viscosity than defective
cream gels with the same composition. This finding was consistent with HIP content and
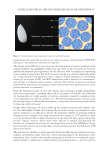
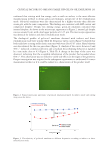
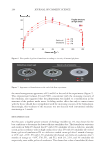
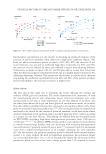
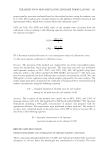
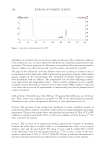
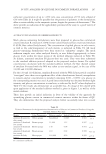
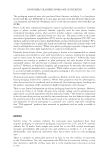
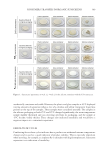
compressed droplets.1 Despite low mixing energy, gel-in-oil emulsions contained thin
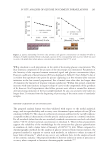
internal droplets. As shown in the microscopic appearance in Figure 2, internal gel droplet
size was around 1 µm, with a few bigger particles of 2–2.5 µm. The microscopic appearance
was identical for indirect and direct emulsification mode.
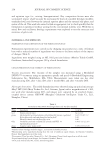
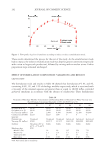
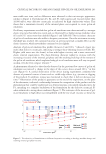
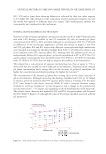
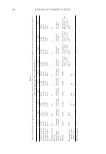
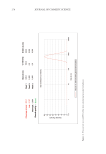
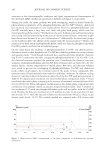
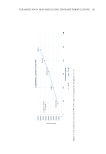
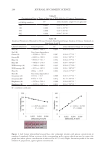
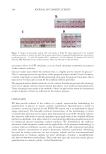
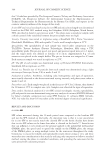
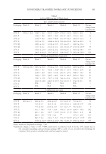
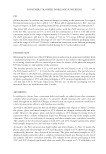
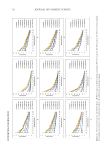
The rheological profiles of gel-in-oil emulsions obtained with indirect and direct
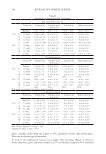
emulsification mode were similar (Table II). Frequency sweep curves (Figure 3) showed that
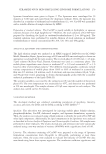
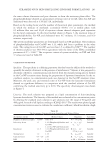
both trials have a strong stable elastic structure with very close G’/G” ratios. Shear behavior
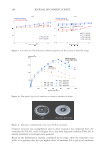
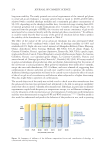
was also identical for the two procedures (Figure 4). Analysis of the curves between 0 and
500 s−1 indicated a similar yield stress and a medium shear-thinning behavior as signaled
by a rate index close to 0.5 (Figure 4, Table II). A change in the slope of the curve was
observed, indicating that the acceptable deformation of the product had exceeded above
600 s−1. This observation was not linked to visible side effects on the edges of the geometry.
Deeper investigation was required in the subsequent experiments to understand if it was a
measurement artifact or if it could be related to a characteristic of the product itself.
Figure 2. Typical microscopic appearance of gel-in-oil emulsion prepared by indirect mode and stirring
using an anchor device.
Figure 3. Viscoelasticity of gel-in-oil emulsions at different frequencies according to indirect or direct
emulsification mode.
confirmed that stirring with low energy, such as with an anchor, is the most effective
manufacturing method to obtain gel-in-oil emulsions, irrespective of the emulsification
mode. Gel-in-oil emulsions were also characterized by a higher viscosity than defective
cream gels with the same composition. This finding was consistent with HIP content and
compressed droplets.1 Despite low mixing energy, gel-in-oil emulsions contained thin
internal droplets. As shown in the microscopic appearance in Figure 2, internal gel droplet
size was around 1 µm, with a few bigger particles of 2–2.5 µm. The microscopic appearance
was identical for indirect and direct emulsification mode.
The rheological profiles of gel-in-oil emulsions obtained with indirect and direct
emulsification mode were similar (Table II). Frequency sweep curves (Figure 3) showed that
both trials have a strong stable elastic structure with very close G’/G” ratios. Shear behavior
was also identical for the two procedures (Figure 4). Analysis of the curves between 0 and
500 s−1 indicated a similar yield stress and a medium shear-thinning behavior as signaled
by a rate index close to 0.5 (Figure 4, Table II). A change in the slope of the curve was
observed, indicating that the acceptable deformation of the product had exceeded above
600 s−1. This observation was not linked to visible side effects on the edges of the geometry.
Deeper investigation was required in the subsequent experiments to understand if it was a
measurement artifact or if it could be related to a characteristic of the product itself.
Figure 2. Typical microscopic appearance of gel-in-oil emulsion prepared by indirect mode and stirring
using an anchor device.
Figure 3. Viscoelasticity of gel-in-oil emulsions at different frequencies according to indirect or direct
emulsification mode.