267 CRITICAL FACTORS TO OBTAIN STABLE HIP GEL-IN-OIL EMULSIONS
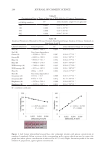
(F11, F12) with a lower shear-thinning behavior as indicated by their rate index superior
to 0.5 (Table IV). The relevance of the comparison may be questioned, however, because
the model was applied to different shear rate ranges. This mathematical analysis was
consequently not considered in the conclusions.
INTERNAL GEL PHASE/EXTERNAL OILY PHASE RATIO
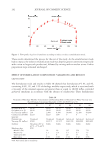
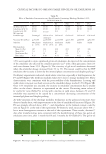
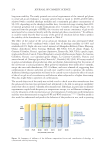
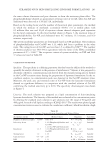
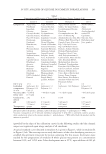
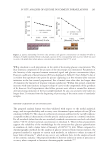
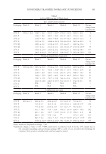
Variations of the oil/internal gel phase concentration and the results in Table V demonstrated
that with 0.8% rheology modifier (a) and 2% emulsifier (d), only an internal gel phase
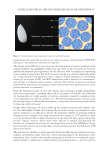
concentration from 80% to 90% provided stable gel-in-oil emulsions (F16, F17, F18) with
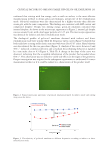
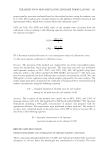
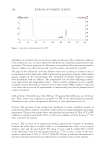
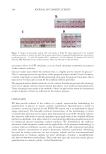
no differences in the microscopic appearance: all thin and similar to Figure 2. For 93%
and 95% gel phase, F14 and F13 respectively, defective cream gels with high conductivity
were obtained. Increasing the rheology modifier from 0.8% to 1% helped to obtain a gel-
in-oil emulsion with 93% aqueous phase, F15, showing that the parameters do not act
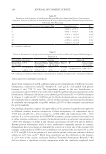
independently. Below 80% aqueous phase, gel-in-oils destabilized at D7 at 45°C. For 75%
aqueous phase, increasing the dose of polymer from 0.8% (F19) to 1.2% (F20) or emulsifier
from 2% (F19) to 3% (F21) does not help to improve the stability of the formulation.
This shows that a concentration of aqueous internal phase less than or equal to 75% or
above 93% was not suitable to create stable gel-in-oil emulsions. Variations of the internal
gel phase concentration had a strong effect on the viscosity of gel-in-oil emulsions: the
higher the concentration and droplet packing, the higher the viscosity.12
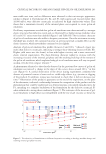
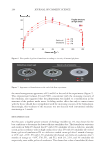
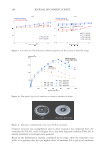
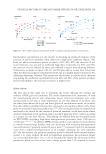
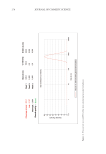
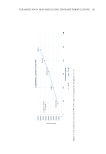
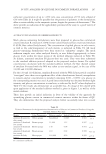
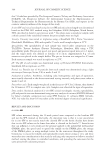
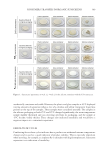
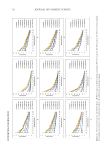
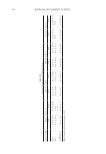
The concentration of the internal gel phase has a strong effect on the elastic structure of
gel-in-oil emulsions. Although increasing the rheology modifier from 0.8% to 1% helped
to obtain a gel-in-oil emulsion with 93% aqueous phase stable at 3 months, F15, the mean
G’/G” ratio showed a low elastic structure (Table V) with a crossover between storage
modulus G’ and loss modulus G” at low frequencies and a change to the predominant
viscous character (G” G’ Figure 12), suggesting a risk of destabilization in the long term.
The relative elastic character was higher for 90% and 85% of aqueous phase and decreased
for 80% (Table V, Figure 12), although the value of the storage modulus increased with the
gel proportion.
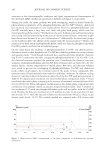
Figure 12. Flow profile of gel-in-oil emulsions according to internal gel phase concentration.
(F11, F12) with a lower shear-thinning behavior as indicated by their rate index superior
to 0.5 (Table IV). The relevance of the comparison may be questioned, however, because
the model was applied to different shear rate ranges. This mathematical analysis was
consequently not considered in the conclusions.
INTERNAL GEL PHASE/EXTERNAL OILY PHASE RATIO
Variations of the oil/internal gel phase concentration and the results in Table V demonstrated
that with 0.8% rheology modifier (a) and 2% emulsifier (d), only an internal gel phase
concentration from 80% to 90% provided stable gel-in-oil emulsions (F16, F17, F18) with
no differences in the microscopic appearance: all thin and similar to Figure 2. For 93%
and 95% gel phase, F14 and F13 respectively, defective cream gels with high conductivity
were obtained. Increasing the rheology modifier from 0.8% to 1% helped to obtain a gel-
in-oil emulsion with 93% aqueous phase, F15, showing that the parameters do not act
independently. Below 80% aqueous phase, gel-in-oils destabilized at D7 at 45°C. For 75%
aqueous phase, increasing the dose of polymer from 0.8% (F19) to 1.2% (F20) or emulsifier
from 2% (F19) to 3% (F21) does not help to improve the stability of the formulation.
This shows that a concentration of aqueous internal phase less than or equal to 75% or
above 93% was not suitable to create stable gel-in-oil emulsions. Variations of the internal
gel phase concentration had a strong effect on the viscosity of gel-in-oil emulsions: the
higher the concentration and droplet packing, the higher the viscosity.12
The concentration of the internal gel phase has a strong effect on the elastic structure of
gel-in-oil emulsions. Although increasing the rheology modifier from 0.8% to 1% helped
to obtain a gel-in-oil emulsion with 93% aqueous phase stable at 3 months, F15, the mean
G’/G” ratio showed a low elastic structure (Table V) with a crossover between storage
modulus G’ and loss modulus G” at low frequencies and a change to the predominant
viscous character (G” G’ Figure 12), suggesting a risk of destabilization in the long term.
The relative elastic character was higher for 90% and 85% of aqueous phase and decreased
for 80% (Table V, Figure 12), although the value of the storage modulus increased with the
gel proportion.
Figure 12. Flow profile of gel-in-oil emulsions according to internal gel phase concentration.