265 CRITICAL FACTORS TO OBTAIN STABLE HIP GEL-IN-OIL EMULSIONS
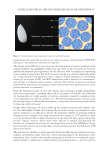
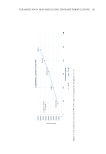
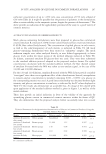
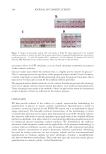
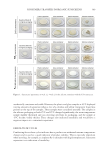
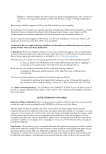
1.5% was required to create optimized gel-in-oil emulsions. As expected, the concentration
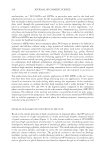
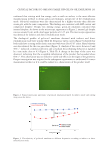
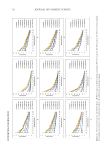
of the emulsifier also affected the emulsion particle size10 with a thin appearance from 2%
and even thinner from 2.5% (Figure 8). The viscosity of gel-in-oil emulsions decreased
when the emulsifier dosage increased from 1% to 3%. The reason could be that for HIP
emulsions the viscosity is driven by the internal phase concentration and droplet packing.17
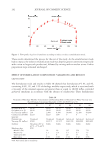
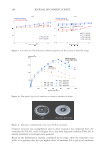
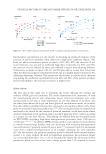
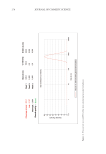
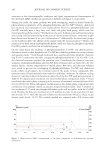
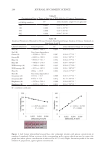
Oscillatory experiments indicated a weak elastic structure, especially at low frequencies, for
F7 and F8 (Figure 9A), with loss modulus values (G”) close to storage modulus (G’). These
characteristics were consistent with the poor stability of the formulations. A strong and
stable elastic structure was built as soon as the emulsifier dosage reached 1.5% (Figure 9B).
Once 1.5% emulsifier was attained, the increase in emulsifier concentration had a smaller
effect on the elastic character as represented on the curves. Decreasing mean values of
G’ and G’/G” ratio (Table IV), in line with a decline in yield stress, between 2% and 3%
emulsifier was assumed to be caused by a concomitant decreasing concentration of the
internal gel phase and droplet packing.
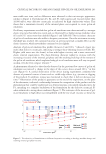
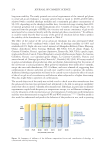
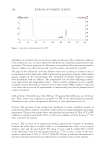
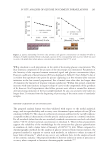
As with variations of the rheology modifier, weaknesses in the gel-in-oil structures were
observed under shear, with improvements as the dose of emulsifier (d) increased (Figure 10).
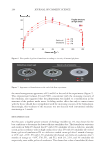
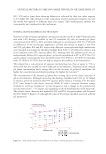
F8 was strongly affected above 400 s−1, and disturbance in the formula texture could be
seen on Figure 11 at the end of the experiment. F9 showed a weak structure above 500 s−1
but a more homogeneous texture at the end of the experiment. These results, obtained 7
days after manufacturing, were consistent with the destabilization of these two gel-in-oil
emulsions over time, after 1 month for F8 and 3 months for F9 (Table IV). The gel-in-oil
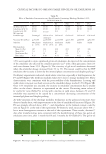
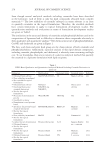
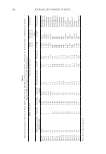
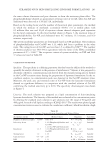
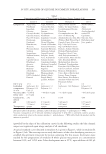
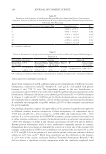
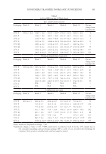
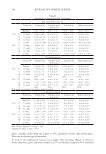
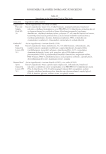
Table IV
Effect of Emulsifier Concentration on a Fixed Formula Containing: Rheology Modifier 1.00%,
Oil 8.00% (w/w %)
F7 F8 F9 F10 F11 F12
(d) Dose (w/w %)00.50 01.00 01.50 02.00 02.50 03.00
Gel phase (w/w %)91.50 91.00 90.50 90.00 89.50 89.00
Conductivity D1/
M1 (μm/cm)
0/330 0/ 20 0/4 0 0 0
Formula type Cream gel Gel-in-oil to
cream gel
Gel-in-oil Gel-in-oil Gel-in-oil Gel-in-oil
Viscosity D1 (mPa·s) ≅78,100 ≅150,000 ≅115,500 ≅113,500 ≅98,500 ≅92,500
Stability Two phases
at −18°C
Exudation at
45°C/−18°C
Exudation
at −18°C
Stable Stable Stable
Rheology data
Mean G’ (Pa) 387 463 640 604 467 396
Mean G’/G” 2.4 2.1 6.6 7.2 5.5 4
Yield stress (Pa) 3 35 87 95 77 57
Rate index 0.35 0.40 0.51 0.47 0.62 0.62
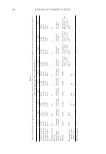
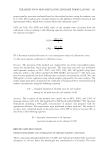
Figure 8. Microscopic appearance of gel-in-oil emulsions according to emulsifier concentration.
1.5% was required to create optimized gel-in-oil emulsions. As expected, the concentration
of the emulsifier also affected the emulsion particle size10 with a thin appearance from 2%
and even thinner from 2.5% (Figure 8). The viscosity of gel-in-oil emulsions decreased
when the emulsifier dosage increased from 1% to 3%. The reason could be that for HIP
emulsions the viscosity is driven by the internal phase concentration and droplet packing.17
Oscillatory experiments indicated a weak elastic structure, especially at low frequencies, for
F7 and F8 (Figure 9A), with loss modulus values (G”) close to storage modulus (G’). These
characteristics were consistent with the poor stability of the formulations. A strong and
stable elastic structure was built as soon as the emulsifier dosage reached 1.5% (Figure 9B).
Once 1.5% emulsifier was attained, the increase in emulsifier concentration had a smaller
effect on the elastic character as represented on the curves. Decreasing mean values of
G’ and G’/G” ratio (Table IV), in line with a decline in yield stress, between 2% and 3%
emulsifier was assumed to be caused by a concomitant decreasing concentration of the
internal gel phase and droplet packing.
As with variations of the rheology modifier, weaknesses in the gel-in-oil structures were
observed under shear, with improvements as the dose of emulsifier (d) increased (Figure 10).
F8 was strongly affected above 400 s−1, and disturbance in the formula texture could be
seen on Figure 11 at the end of the experiment. F9 showed a weak structure above 500 s−1
but a more homogeneous texture at the end of the experiment. These results, obtained 7
days after manufacturing, were consistent with the destabilization of these two gel-in-oil
emulsions over time, after 1 month for F8 and 3 months for F9 (Table IV). The gel-in-oil
Table IV
Effect of Emulsifier Concentration on a Fixed Formula Containing: Rheology Modifier 1.00%,
Oil 8.00% (w/w %)
F7 F8 F9 F10 F11 F12
(d) Dose (w/w %)00.50 01.00 01.50 02.00 02.50 03.00
Gel phase (w/w %)91.50 91.00 90.50 90.00 89.50 89.00
Conductivity D1/
M1 (μm/cm)
0/330 0/ 20 0/4 0 0 0
Formula type Cream gel Gel-in-oil to
cream gel
Gel-in-oil Gel-in-oil Gel-in-oil Gel-in-oil
Viscosity D1 (mPa·s) ≅78,100 ≅150,000 ≅115,500 ≅113,500 ≅98,500 ≅92,500
Stability Two phases
at −18°C
Exudation at
45°C/−18°C
Exudation
at −18°C
Stable Stable Stable
Rheology data
Mean G’ (Pa) 387 463 640 604 467 396
Mean G’/G” 2.4 2.1 6.6 7.2 5.5 4
Yield stress (Pa) 3 35 87 95 77 57
Rate index 0.35 0.40 0.51 0.47 0.62 0.62
Figure 8. Microscopic appearance of gel-in-oil emulsions according to emulsifier concentration.