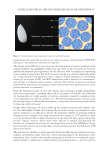
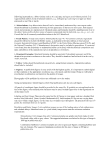
283 CERAMIDE-NP IN SKIN-SIMULATING LIPOSOME FORMULATIONS
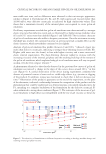
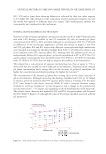
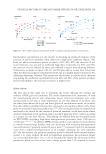
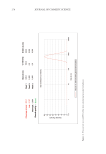
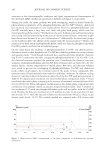
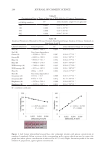
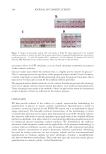
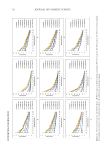
the same column dimension and pore diameter to show the stationary phase effect. The
phosphatidylcholine showed an approximate retention time of 11.648, when Cer-NP and
cholesterol were detected at 4.58 and 5.18, individually.
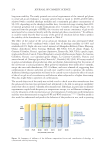
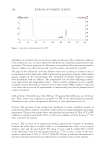
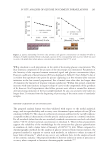
Based on the tailing factor and the number of theoretical plate parameters, the method
in which the mixture of methanol: acetonitrile (60:40, v/v) as mobile phase with
0.5 mL/min flow rate and 10 µL of injection volume showed adequate peak separation
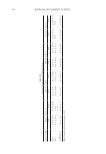
for the lipid components. In this final method shown in Figure 3, the retention times of
phosphatidylcholine, Cer-NP, and cholesterol were 10.7 minutes, 13.5 minutes, and 16.0
minutes, respectively.
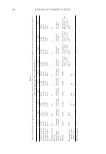
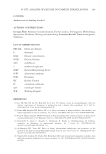
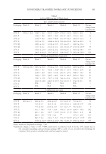
The system suitability parameters are determined based on USP guidelines. The resolution
of phosphatidylcholine and Cer-NP was 4.14, which had been a problem in the other
trials. The tailing factor of Cer-NP was less than 1.5 as defined by USP.22,23 The number
of theoretical plates was 5913.479 in agreement with the limit of the FDA’s established
parameter of N 2.000.24 The acceptance criteria of system suitability on USP and Trial
17 values are listed in Table III.
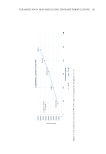
VALIDATION OF METHOD
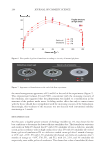
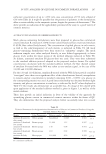
Specificity. The specificity is a defining parameter that has been the ability of the method to
quantify the analyte of interest in the presence of interferences.16 Herein, it was proposed to
determine whether a contamination peak derived from the manufacturing process formed
in the Cer-NP retention times during the preparation of liposome formulation. In the set
condition analysis, no contamination peak was detected in the Cer-NP retention times.
Moreover, the peak area and retention time of Cer-NP from the liposome formulation
showed no significant difference in comparison with the standard solution of Cer-NP,
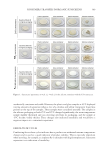
confirming the method selectivity (p ≤ 0.05). The specificity chromatogram was shown
in Figure 4.
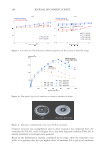
Linearity. The stock solution was prepared at a lipid concentration of skin-simulating
liposome formulation. The linearity of the method was evaluated at five concentration points
by diluting the standard stock solution to get solutions over the range of 80 µg/mL and
480 µg/mL for each of all lipids according to ICH Q2 (R1).16 The results were plotted graph
concentration versus an area to evaluate the correlation coefficient, which has shown a high
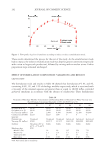
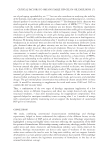
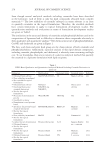
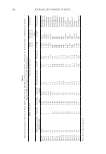
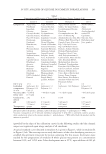
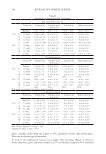
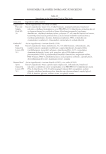
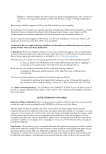
Table III
The Acceptance Criteria of System Suitability and Method Values
Acceptance criteria Method values Equation Suitability
Number of theoretical plate 2000 5913.479 N =16 (tx/wx) Suitable
Selectivity factor 1 1.42 (Phosphatidylcholine and
Cer-NP)
1.21 (Cer-NP and Cholesterol)
α =(ty − tm)/
(tx − tm)
Suitable
Resolution 1.5 4.14 (Phosphatidylcholine and
Cer-NP)
R =(ty − tx)/
0.5(wy +wx)
Suitable
Tailing factor 2 1.19 Tf =w0.05/2f Suitable
Capacity factor 0.5 – 20 2,64 K =(tx − tm)/tm Suitable
RSD 2 1,13 =SD × 100/mean Suitable
the same column dimension and pore diameter to show the stationary phase effect. The
phosphatidylcholine showed an approximate retention time of 11.648, when Cer-NP and
cholesterol were detected at 4.58 and 5.18, individually.
Based on the tailing factor and the number of theoretical plate parameters, the method
in which the mixture of methanol: acetonitrile (60:40, v/v) as mobile phase with
0.5 mL/min flow rate and 10 µL of injection volume showed adequate peak separation
for the lipid components. In this final method shown in Figure 3, the retention times of
phosphatidylcholine, Cer-NP, and cholesterol were 10.7 minutes, 13.5 minutes, and 16.0
minutes, respectively.
The system suitability parameters are determined based on USP guidelines. The resolution
of phosphatidylcholine and Cer-NP was 4.14, which had been a problem in the other
trials. The tailing factor of Cer-NP was less than 1.5 as defined by USP.22,23 The number
of theoretical plates was 5913.479 in agreement with the limit of the FDA’s established
parameter of N 2.000.24 The acceptance criteria of system suitability on USP and Trial
17 values are listed in Table III.
VALIDATION OF METHOD
Specificity. The specificity is a defining parameter that has been the ability of the method to
quantify the analyte of interest in the presence of interferences.16 Herein, it was proposed to
determine whether a contamination peak derived from the manufacturing process formed
in the Cer-NP retention times during the preparation of liposome formulation. In the set
condition analysis, no contamination peak was detected in the Cer-NP retention times.
Moreover, the peak area and retention time of Cer-NP from the liposome formulation
showed no significant difference in comparison with the standard solution of Cer-NP,
confirming the method selectivity (p ≤ 0.05). The specificity chromatogram was shown
in Figure 4.
Linearity. The stock solution was prepared at a lipid concentration of skin-simulating
liposome formulation. The linearity of the method was evaluated at five concentration points
by diluting the standard stock solution to get solutions over the range of 80 µg/mL and
480 µg/mL for each of all lipids according to ICH Q2 (R1).16 The results were plotted graph
concentration versus an area to evaluate the correlation coefficient, which has shown a high
Table III
The Acceptance Criteria of System Suitability and Method Values
Acceptance criteria Method values Equation Suitability
Number of theoretical plate 2000 5913.479 N =16 (tx/wx) Suitable
Selectivity factor 1 1.42 (Phosphatidylcholine and
Cer-NP)
1.21 (Cer-NP and Cholesterol)
α =(ty − tm)/
(tx − tm)
Suitable
Resolution 1.5 4.14 (Phosphatidylcholine and
Cer-NP)
R =(ty − tx)/
0.5(wy +wx)
Suitable
Tailing factor 2 1.19 Tf =w0.05/2f Suitable
Capacity factor 0.5 – 20 2,64 K =(tx − tm)/tm Suitable
RSD 2 1,13 =SD × 100/mean Suitable