295 IN SITU ANALYSIS OF GLUCOSE IN COSMETIC FORMULATIONS
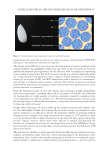
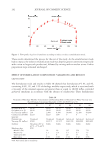
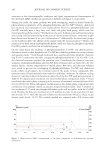
WR/g emulsion to each preparation, in the order of decreasing glucose concentration. The
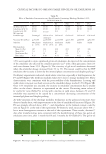
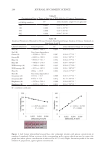
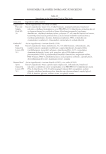
blue intensity component of the pictures of the microstrips was monitored. Parameters of
the linearity of the response between measured signal and glucose concentration (slope,
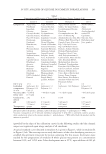
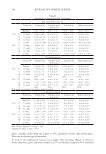
Pearson’s coefficient of determination (R2)) are displayed in Table IV. From Table IV data it
is evident that optimum time point for picture capturing is at five minutes (after reaction
initiation in the last treated preparation). For a limited time after that (no longer than
20 minutes), the linearity of response remains satisfactory. Within this period, sensitivity
increases with time (increase in negative slope of curve) at the compromise of the goodness
of fit, however. In all experiments that follow, pictures were taken at around five minutes
after processing initiation of the last sample/standard. In any case, pictures were taken no
longer than 25 minutes from the beginning of processing of the entire series of standards/
samples.
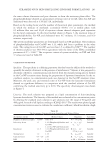
METHOD VALIDATION IN AN O/W EMULSION
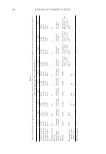
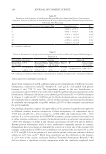
The proposed analysis format was then validated with respect to the useful analytical
range, and its reproducibility and accuracy were determined upon analysis of two QCs in
emulsion A (Table V). The values of coefficient of variation and bias for the two QCs indicate
acceptable technical characteristics for the specific analysis purpose in a cosmetic emulsion.
For all standards (other than the zero standard), standard concentration was back-calculated
within ±20.5% of their nominal concentration in emulsion A. These technical parameters
support the reliability of the methodology for the extraction-free glucose quantification
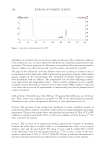
in emulsion A, with a lower limit of linearity of 0.91*10−3% w/w. When compared to
chromatographic methods for the analysis of glucose extracted from various matrices, the
proposed method is superior to certain such methods, or inferior to others in terms of
lower limit of linearity12, which in any case is very sufficient here, for the analytical needs
of the cosmetic industry. The proposed method is however inferior in terms of precision or
accuracy when compared to literature chromatographic methods.18,19
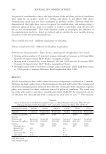
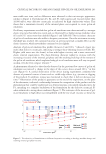
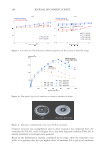
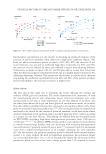
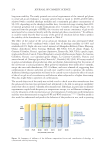
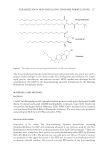
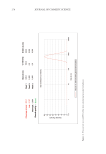
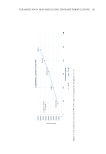
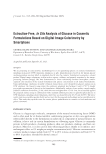
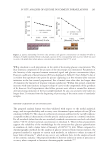
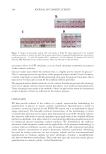
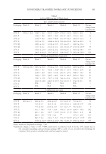
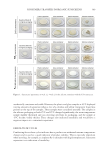
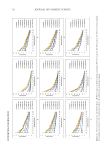
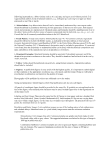
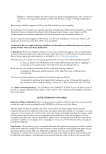
Figure 2. Linear relationship between color intensity and glucose concentration in emulsion B (left) or
shampoo A (right) standards. Below each graph, a picture of the corresponding wells is given, which was used
to extract the graph data (where glucose concentration is indicated (in 10−3% w/w)).
WR/g emulsion to each preparation, in the order of decreasing glucose concentration. The
blue intensity component of the pictures of the microstrips was monitored. Parameters of
the linearity of the response between measured signal and glucose concentration (slope,
Pearson’s coefficient of determination (R2)) are displayed in Table IV. From Table IV data it
is evident that optimum time point for picture capturing is at five minutes (after reaction
initiation in the last treated preparation). For a limited time after that (no longer than
20 minutes), the linearity of response remains satisfactory. Within this period, sensitivity
increases with time (increase in negative slope of curve) at the compromise of the goodness
of fit, however. In all experiments that follow, pictures were taken at around five minutes
after processing initiation of the last sample/standard. In any case, pictures were taken no
longer than 25 minutes from the beginning of processing of the entire series of standards/
samples.
METHOD VALIDATION IN AN O/W EMULSION
The proposed analysis format was then validated with respect to the useful analytical
range, and its reproducibility and accuracy were determined upon analysis of two QCs in
emulsion A (Table V). The values of coefficient of variation and bias for the two QCs indicate
acceptable technical characteristics for the specific analysis purpose in a cosmetic emulsion.
For all standards (other than the zero standard), standard concentration was back-calculated
within ±20.5% of their nominal concentration in emulsion A. These technical parameters
support the reliability of the methodology for the extraction-free glucose quantification
in emulsion A, with a lower limit of linearity of 0.91*10−3% w/w. When compared to
chromatographic methods for the analysis of glucose extracted from various matrices, the
proposed method is superior to certain such methods, or inferior to others in terms of
lower limit of linearity12, which in any case is very sufficient here, for the analytical needs
of the cosmetic industry. The proposed method is however inferior in terms of precision or
accuracy when compared to literature chromatographic methods.18,19
Figure 2. Linear relationship between color intensity and glucose concentration in emulsion B (left) or
shampoo A (right) standards. Below each graph, a picture of the corresponding wells is given, which was used
to extract the graph data (where glucose concentration is indicated (in 10−3% w/w)).