279 CERAMIDE-NP IN SKIN-SIMULATING LIPOSOME FORMULATIONS
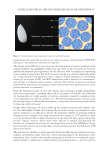
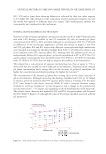
liposome formulation were given in Figure 2. The liposomes were centrifuged for 30
minutes at 3,000 rpm and parted from the dispersion medium. Then, the liposome was
dissolved in a mixture of methanol and tetrahydrofuran (1:1, v/v). Cer-NP was quantified
with a suitable dilution of sample solutions by HPLC.
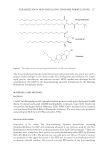
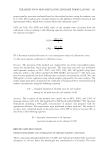
Preparation of standard solutions. The Cer-NP is poorly soluble in hydrophilic or aqueous
solutions because of its high lipophilicity.15 Therefore, the stock solutions of Cer-NP were
prepared by dissolving the lipids in methanol/tetrahydrofuran (1:1) at 480 µg/mL. The
standard solutions were performed by suitable dilution of stock solutions in methanol/
tetrahydrofuran at various concentrations (80, 200, 320, 400, and 480 µg/mL).
ANALYTICAL EQUIPMENT AND CHROMATOGRAPHIC
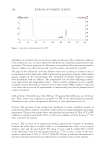
The lipid solution sample was analyzed at an HPLC-equipped DAD-detector (LC-20AD
Model, Shimadzu, Kyoto, Japan) in a range of 190 nm and 800 nm wavelength, to choose an
appropriate wavelength for the next analysis. The reversed-phase C-18 (150 mm × 4.6 mm,
5 µm) column (Macherey-Nagel, Dueren, Germany) was used as a stationary phase. The
mobile phase ingredients were chosen as methanol (P’ =3.0) and acetonitrile (P’ =3.1)
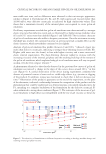
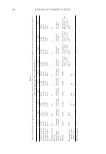
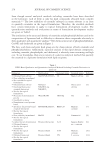
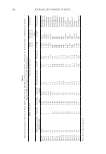
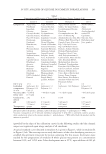
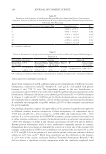
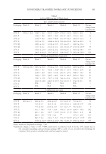
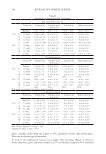
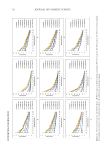
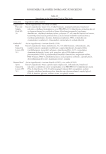
based on their reversed phase polarity.12 The different chromatographic conditions include
various compositions of mobile phase (from 100% to 60% of methanol in acetonitrile),
flow rate (0.5 mL/min, 0.8 mL/min, and 1.0 mL/min), and injection volume (10 µL, 50 µL,
and 80 µL) were tested, proposing to obtain chromatographic peaks with the acceptable
analytical performance of the lipids (Table II).
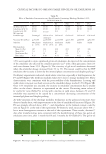
The system’s suitability was tested by the tailing factor (T
f )and the number of theoretical
plates (N). The oven temperature was maintained at 45°C, and detection was performed
at 210 nm wavelength. The sample volumes of 10 µL were injected in each analysis. The
analysis was carried out for 20 minutes.
VALIDATION OF METHOD
The developed method was validated considering parameters of specificity, linearity,
accuracy, precision, the LOD, and the LOQ according to ICH Q2(R1).16,17
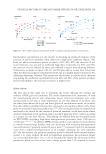
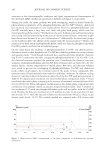
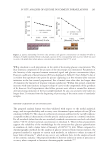
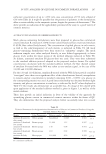
Specificity. The selectivity was investigated by injecting mobile phase (blank) solution,
phosphatidylcholine, Cer-NP, cholesterol samples, and liposome formulation, separately.
Then, the analysis was evaluated using a blank solution to identify the peak of Cer-NP and
other lipid components. Additionally, the lipid components in the liposomes were analyzed
as described in Section Analytical Equipment and Chromatographic Conditions. All samples were
performed in three replicates. The results of peak area and retention time were statistically
analyzed using a one-way analysis of variance (ANOVA) with a significance level of 0.05.
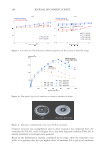
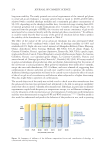
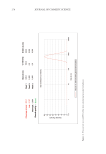
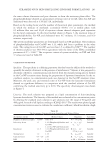
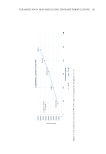
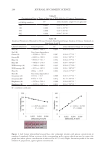
Linearity. The solutions consisting of Cer-NP were prepared at the range of liposome
formulation concentration from 80 µg/mL to 480 µg/mL, performing at least three
replicates. Then, the assays were analyzed to evaluate the linearity of Cer-NP. The data
were fitted using linear least squares regression. The correlation coefficient significance and
liposome formulation were given in Figure 2. The liposomes were centrifuged for 30
minutes at 3,000 rpm and parted from the dispersion medium. Then, the liposome was
dissolved in a mixture of methanol and tetrahydrofuran (1:1, v/v). Cer-NP was quantified
with a suitable dilution of sample solutions by HPLC.
Preparation of standard solutions. The Cer-NP is poorly soluble in hydrophilic or aqueous
solutions because of its high lipophilicity.15 Therefore, the stock solutions of Cer-NP were
prepared by dissolving the lipids in methanol/tetrahydrofuran (1:1) at 480 µg/mL. The
standard solutions were performed by suitable dilution of stock solutions in methanol/
tetrahydrofuran at various concentrations (80, 200, 320, 400, and 480 µg/mL).
ANALYTICAL EQUIPMENT AND CHROMATOGRAPHIC
The lipid solution sample was analyzed at an HPLC-equipped DAD-detector (LC-20AD
Model, Shimadzu, Kyoto, Japan) in a range of 190 nm and 800 nm wavelength, to choose an
appropriate wavelength for the next analysis. The reversed-phase C-18 (150 mm × 4.6 mm,
5 µm) column (Macherey-Nagel, Dueren, Germany) was used as a stationary phase. The
mobile phase ingredients were chosen as methanol (P’ =3.0) and acetonitrile (P’ =3.1)
based on their reversed phase polarity.12 The different chromatographic conditions include
various compositions of mobile phase (from 100% to 60% of methanol in acetonitrile),
flow rate (0.5 mL/min, 0.8 mL/min, and 1.0 mL/min), and injection volume (10 µL, 50 µL,
and 80 µL) were tested, proposing to obtain chromatographic peaks with the acceptable
analytical performance of the lipids (Table II).
The system’s suitability was tested by the tailing factor (T
f )and the number of theoretical
plates (N). The oven temperature was maintained at 45°C, and detection was performed
at 210 nm wavelength. The sample volumes of 10 µL were injected in each analysis. The
analysis was carried out for 20 minutes.
VALIDATION OF METHOD
The developed method was validated considering parameters of specificity, linearity,
accuracy, precision, the LOD, and the LOQ according to ICH Q2(R1).16,17
Specificity. The selectivity was investigated by injecting mobile phase (blank) solution,
phosphatidylcholine, Cer-NP, cholesterol samples, and liposome formulation, separately.
Then, the analysis was evaluated using a blank solution to identify the peak of Cer-NP and
other lipid components. Additionally, the lipid components in the liposomes were analyzed
as described in Section Analytical Equipment and Chromatographic Conditions. All samples were
performed in three replicates. The results of peak area and retention time were statistically
analyzed using a one-way analysis of variance (ANOVA) with a significance level of 0.05.
Linearity. The solutions consisting of Cer-NP were prepared at the range of liposome
formulation concentration from 80 µg/mL to 480 µg/mL, performing at least three
replicates. Then, the assays were analyzed to evaluate the linearity of Cer-NP. The data
were fitted using linear least squares regression. The correlation coefficient significance and