297 IN SITU ANALYSIS OF GLUCOSE IN COSMETIC FORMULATIONS
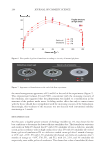
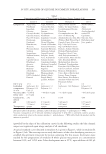
surfactant concentration of up to ∼20% w/w, urea concentration of 15% w/w, ethanol of
62% w/w (Table I)). It might be possible that the presence of polymers in the formulations
offers a certain stability to the enzymatic system, despite the presence of denaturants.21 The
above provide an indication of the applicability potential of the assay to a good variety of
cosmetic matrices.
ACCURACY UPON ANALYSIS OF COMMERCIAL PRODUCTS
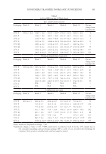
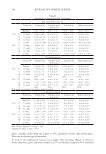
Mock glucose-containing formulations were then prepared in glucose-free commercial
creams (emulsion B, emulsion C (O/W, brown-colored hand and foot cream) and emulsion
D (O/W, blue-colored body butter)). The concentration of spiked glucose in each matrix,
as well as the color/transparency of each matrix, is indicated in Table VI. All mock
glucose-containing formulations were then treated as “unknown” samples. The mock
unknown samples were either analyzed directly, or were diluted appropriately, to lower
glucose levels within the linear region of the method (dilution indicated in Table VI).
As diluent, untreated emulsion B (glucose-free) was used. They were then submitted
to the standard addition protocol adapted to the proposed analysis format. For spiked
concentration calculation with the standard addition method, the blue channel output
of emulsion B treated with the WR was taken as zero-analyte signal, in the case of the
1:1,000 and 1:10,000 dilutions.
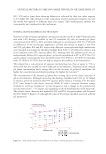
For the 1:40 and 1:10 dilutions, emulsion B treated with the WR did not provide a suitable
“zero signal” since there was a significant effect of the colored matrix. Instead, extrapolation
to nonzero-analyte concentration (a standard containing 0.001 – 0.005% w/w glucose in
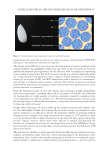
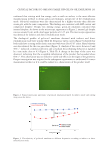
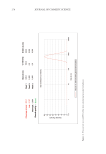
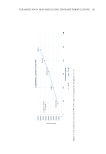
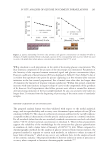
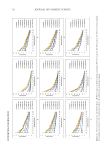
the corresponding matrix) was used. A good linear relationship was obtained between light
intensity and glucose concentration in emulsion, as indicated by the R2 values displayed in
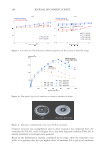
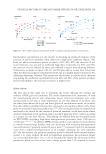
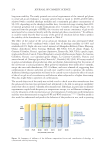
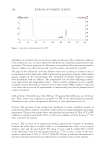
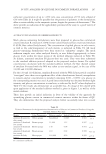
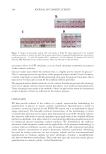
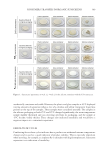
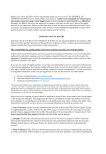
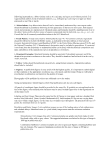
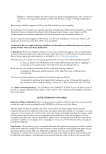
Table VI. Our results also demonstrate an acceptable bias. An image of the colored wells
upon application of the standard addition method is given in Figure 3, as well as of the
initial emulsion.
These data provide an initial indication in favor of the validity of the approach for
quantifying glucose content in commercial cosmetic matrices within the frame of QC.
They also demonstrate that the proposed analysis format successfully takes into account
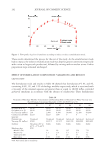
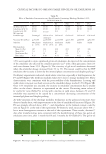
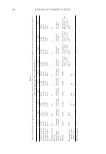
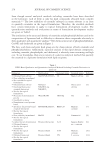
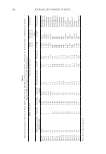
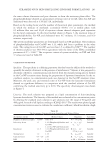
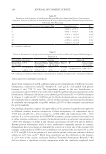
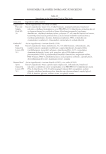
Table VI
Technical Parameters for the Quantitative Determination of Glucose in Commercial Products Using the
Standard Addition Procedure
Matrix Color Transparency Dilution applied Spiked [Glu], %w/w R2 Bias %
emulsion B (sensitive
skin cream)
White opaque Nondiluted 0.0091 0.993 −15.3
emulsion C (hand and
foot cream)
Brown opaque 1:1,000 3.12 0.997 +4.9
emulsion C (hand and
foot cream)
Brown opaque 1:40 0.08 0.991 +3.2
emulsion C (hand and
foot cream)
Brown opaque 1:10 0.02 0.999 +13.12
emulsion D (body
butter)
Blue opaque 1:10,000 8.26 0.995 +15.9
R2: correlation coefficient.
surfactant concentration of up to ∼20% w/w, urea concentration of 15% w/w, ethanol of
62% w/w (Table I)). It might be possible that the presence of polymers in the formulations
offers a certain stability to the enzymatic system, despite the presence of denaturants.21 The
above provide an indication of the applicability potential of the assay to a good variety of
cosmetic matrices.
ACCURACY UPON ANALYSIS OF COMMERCIAL PRODUCTS
Mock glucose-containing formulations were then prepared in glucose-free commercial
creams (emulsion B, emulsion C (O/W, brown-colored hand and foot cream) and emulsion
D (O/W, blue-colored body butter)). The concentration of spiked glucose in each matrix,
as well as the color/transparency of each matrix, is indicated in Table VI. All mock
glucose-containing formulations were then treated as “unknown” samples. The mock
unknown samples were either analyzed directly, or were diluted appropriately, to lower
glucose levels within the linear region of the method (dilution indicated in Table VI).
As diluent, untreated emulsion B (glucose-free) was used. They were then submitted
to the standard addition protocol adapted to the proposed analysis format. For spiked
concentration calculation with the standard addition method, the blue channel output
of emulsion B treated with the WR was taken as zero-analyte signal, in the case of the
1:1,000 and 1:10,000 dilutions.
For the 1:40 and 1:10 dilutions, emulsion B treated with the WR did not provide a suitable
“zero signal” since there was a significant effect of the colored matrix. Instead, extrapolation
to nonzero-analyte concentration (a standard containing 0.001 – 0.005% w/w glucose in
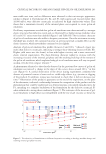
the corresponding matrix) was used. A good linear relationship was obtained between light
intensity and glucose concentration in emulsion, as indicated by the R2 values displayed in
Table VI. Our results also demonstrate an acceptable bias. An image of the colored wells
upon application of the standard addition method is given in Figure 3, as well as of the
initial emulsion.
These data provide an initial indication in favor of the validity of the approach for
quantifying glucose content in commercial cosmetic matrices within the frame of QC.
They also demonstrate that the proposed analysis format successfully takes into account
Table VI
Technical Parameters for the Quantitative Determination of Glucose in Commercial Products Using the
Standard Addition Procedure
Matrix Color Transparency Dilution applied Spiked [Glu], %w/w R2 Bias %
emulsion B (sensitive
skin cream)
White opaque Nondiluted 0.0091 0.993 −15.3
emulsion C (hand and
foot cream)
Brown opaque 1:1,000 3.12 0.997 +4.9
emulsion C (hand and
foot cream)
Brown opaque 1:40 0.08 0.991 +3.2
emulsion C (hand and
foot cream)
Brown opaque 1:10 0.02 0.999 +13.12
emulsion D (body
butter)
Blue opaque 1:10,000 8.26 0.995 +15.9
R2: correlation coefficient.