281 CERAMIDE-NP IN SKIN-SIMULATING LIPOSOME FORMULATIONS
proportionality tests were evaluated based on the residual variance using the student t-test
(p =0.05). The residues were calculated based on the difference between theoretical and
experimental values, which were estimated from the calibration curve.18
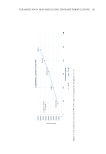
LOD and LOQ. The LOD and LOQ values of the method were calculated from the
calibration curves according to the following equations based on the standart deviation of
the response and slope:17
LOD SD
S =× 3 3 .
LOQ SD
S =× 10
SD is the mean standard deviation of y-axis interception values of calibration curves
S is the mean angular coefficient of calibration curves.
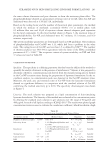
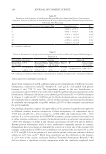
Precision. The precision of the method was evaluated for two levels: repeatability (intra-
assay) and intermediate (inter-assay) precision. The intra-assay precision was performed
with liposome analytes at 80%, 100%, and 120% (320, 400, 480 µg/mL) using three
replicates within a day which qualified the ICH Q2(R1) specifications.16 The inter-assay
precision was performed on three different days at analyte concentrations of (320, 400, and
480 µg/mL) in three replicates using refresh samples prepared by the same analysis. The
results of precision were calculated as the coefficient of variation (CV) in each level for each
analyte concentration, using the following equation:
CV deviation of the peak areas for each analyte/ =(standard
a average of the peak areas for each analyte) × 100
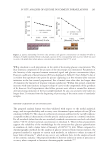
Accuracy. The accuracy of the method was carried out at 80%, 100%, and 120% of
liposome analytes (320, 400, 480 µg/mL) of Cer-NP based on ICH Q2(R1).16 The liposome
formulation including a 600 µg/mL concentration of analytes was prepared with the
appropriate dilutions. The experiments were performed in three replicates. The results of
accuracy were calculated based on the peak areas of Cer-NP in terms of recovery (R), as
described in the following equation:
R measured concentration in the liposomes/
measured concent
=(
tration in the solutions) × 100
RESULTS AND DISCUSSION
METHOD DEVELOPMENT AND OPTIMIZATION OF CHROMATOGRAPHIC CONDITIONS
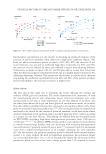
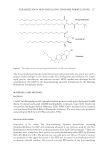
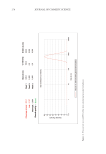
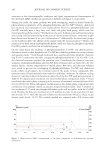
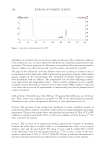
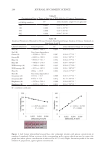
Three compounds (phosphatidylcholine, Cer-NP, and cholesterol) exhibited the maximum
absorption at 210 nm hence the wavelength was standardized in all studies. The main
proportionality tests were evaluated based on the residual variance using the student t-test
(p =0.05). The residues were calculated based on the difference between theoretical and
experimental values, which were estimated from the calibration curve.18
LOD and LOQ. The LOD and LOQ values of the method were calculated from the
calibration curves according to the following equations based on the standart deviation of
the response and slope:17
LOD SD
S =× 3 3 .
LOQ SD
S =× 10
SD is the mean standard deviation of y-axis interception values of calibration curves
S is the mean angular coefficient of calibration curves.
Precision. The precision of the method was evaluated for two levels: repeatability (intra-
assay) and intermediate (inter-assay) precision. The intra-assay precision was performed
with liposome analytes at 80%, 100%, and 120% (320, 400, 480 µg/mL) using three
replicates within a day which qualified the ICH Q2(R1) specifications.16 The inter-assay
precision was performed on three different days at analyte concentrations of (320, 400, and
480 µg/mL) in three replicates using refresh samples prepared by the same analysis. The
results of precision were calculated as the coefficient of variation (CV) in each level for each
analyte concentration, using the following equation:
CV deviation of the peak areas for each analyte/ =(standard
a average of the peak areas for each analyte) × 100
Accuracy. The accuracy of the method was carried out at 80%, 100%, and 120% of
liposome analytes (320, 400, 480 µg/mL) of Cer-NP based on ICH Q2(R1).16 The liposome
formulation including a 600 µg/mL concentration of analytes was prepared with the
appropriate dilutions. The experiments were performed in three replicates. The results of
accuracy were calculated based on the peak areas of Cer-NP in terms of recovery (R), as
described in the following equation:
R measured concentration in the liposomes/
measured concent
=(
tration in the solutions) × 100
RESULTS AND DISCUSSION
METHOD DEVELOPMENT AND OPTIMIZATION OF CHROMATOGRAPHIC CONDITIONS
Three compounds (phosphatidylcholine, Cer-NP, and cholesterol) exhibited the maximum
absorption at 210 nm hence the wavelength was standardized in all studies. The main