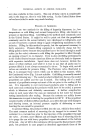
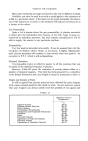
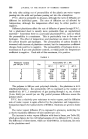
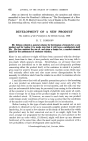
414 JOURNAL OF THE SOCIETY OF COSMETIC CHEMISTS Concentration « 1 2 3 g./litre ' 4 g. Fat per plate 2 11 20 I 24 plates 2 g. Fat per plate 2 12 23 [ 26 plates 1 g. Fat per plate 3 11 26 28 plates « g. Fat per plate 1 12 26 28 plates and the detergent. Clearly the solid surface of the plates is concerned in the •nechanism of the washing, and the fact that detergency is a process of removal of soil must be kept clearly to the fore. Nevertheless, it is possible that a limited range of detergents with a suitable soil will show some correla- tion between soil/detergent interaction and dishwashing, and this has been demonstrated by Lloyd E. Weeks et al. 8 But this relationship is not funda- mental it does not hold for certain types of detergents, and is shown only with certain types of soil. As this series of articles is concerned largely with statistical methods, it may be considered pertinent here to criticise the statistical analysis of the _paper just referred to. Lloyd E. Weeks, et al., gave the line of best fit as: Y = 6.90 + 22.07 X --where X • grams of soil added in the foaming test, and Y = number of plates washed in the dishwashing test, but almost an equally good fit is: Y •- 30.7 X --representing direct proportionality of the tests. The standard deviation from the line is only q- 2.3 plates, which is litfie more than the random spread of q- 1.94 plates. The variance ratio is 1-48, which is not even significant at a 20 per cent significance level. Thus, the data are quite consistent with the hypothesis represented by Y---- 30.7 X and yet the paper quotes 95 per cent limits, which exclude this possibility. STUDY OF DIFFERENT SOILS In the first article of this series it was pointed out that both natural and artificial soils have their place in a programme of detergent evaluation. Work described there showed that the preparation of artificial soils could not be reproduced very closely, and batch-to-batch variations were just as significant as with natural soils. The preference of the laboratory assistants was for natural soils as the use of these eliminates the work of preparing the plates. When more efficient detergents came to be evaluated, tests with natural soils often required 30 or more plates and became unduly prolonged, with the result that the labour of soiling that was saved was then expended in washing. The testers' preference, therefore, swung over to the use of synthetic soils that would give results mostly in the range of 10-20 plates. Results restricted to this range have two further advantages in that moie

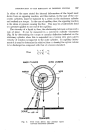
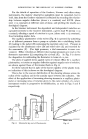
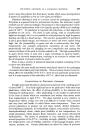
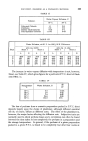
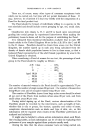
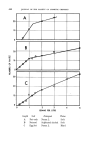
DEVELOPMENT OF A DETERGENT TEST 415 tests may be made for each group of plates available, and that complications due to a large decrease in temperature are lessened. An investigation into the differences between the results of tests using different soils gave a picture far too complicated to be described in the present article. The effect of varying the quantity of soil per plate differed with different soils, as mentioned in the previous section, and the effect of varying concentration of detergent differed with different detergents. The data to be published will therefore be confined to some typical series of results. CONCENTRATION OF DETERGENT All tests reported in the previous articles have been made with a range of four concentrations of detergent. This was done simply to broaden the validity of any conclusions that might be drawn from the data, and the respective performances of the different solutions were not compared. However, when the results are plotted, as in the graphs (p. 416), each curve appears to consist of two linear portions, the first section being steep and passing through, or near to, the origin, whilst beyond the intersection the number of plates increases more slowly than the concentration. The slopes of the first sections of the curves are quite different for the three cases, and the magnitudes of the changes of slope are different. The change in slope of each curve can be identified with the critical micelle concentration which was determined as 1.7 g.p.1. for Nansa L Liquid and 1.2 g.p.1. for the sulphated alcohol,-using the fluorescent dye method. As the sulphated alcohol was a solution of 20 per cent active matter, the change in slope occurs at 0.024 per cent, which agrees with Pugh's statement (see reference 4) of "a linear relationship between the number of plates washed and the concentration over the range 0.025 per cent to 0.1 per cent active matter." To this we might add that the linear relationship must not be confused with direct proportionality, for doubling the concentration from 1-5 to 3 g.p.1. increases the plates from 14 to 20 only. The most significant aspects of the concentration effect as regards con- siderations of a practical test is that comparisons of different detergents made below the critical concentration will bear no resemblance to those made above. This seems not to be generally appreciated, and most of the published data compare different detergents at single arbitrary concentrations which give results so limited as to be misleading. Lloyd E. Weeks, et al., a specify 0-1 per cent active concentration, which is well above the critical concentration and thus is not subject to the same criticisms as the recommended procedure reported by Louis E. Wells.5 The latter uses 0-1 per cent "as is" detergent concentration which will lie above, below, or within the critical region for different detergents.
Purchased for the exclusive use of nofirst nolast (unknown)
From: SCC Media Library & Resource Center (library.scconline.org)