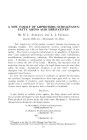
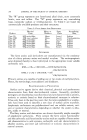
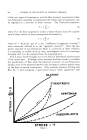
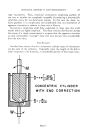
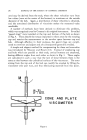
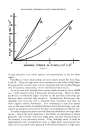
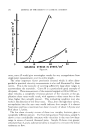
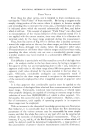
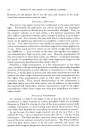
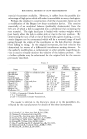
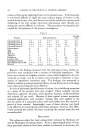
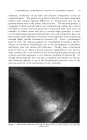
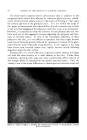
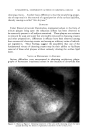
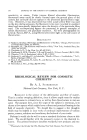
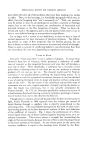
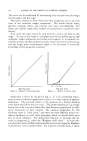
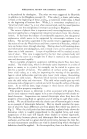
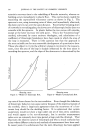
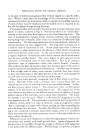
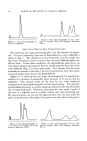
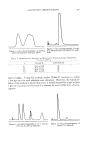
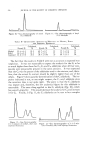
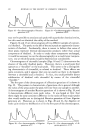
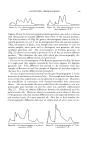
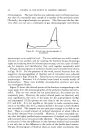
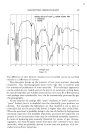
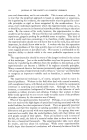
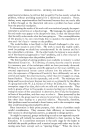
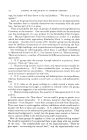
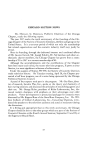
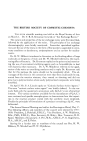
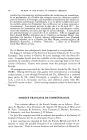
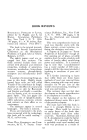
320 JOURNAL OF THE SOCIETY OF COSMETIC CHEMISTS Figure 10.--Gas chromatography of nonyl Figure 11.--Gas chromatography of decy! (Co) aidehyde. (C,0) aidehyde. TABLE II--QuANTITATIVE ANALYSIS OF MIXTURES OF •IETHYL, ETHYL AND ISOPROPYL BENZOATES Calculated, Calculated, Calculated, Found, % % Found, % % Found, % Methyl 32.6 q- 0.5 33.3 49.7 4- 0.7 50 25.1 4- 0.4 25 Ethyl 34.0 4- 0.9 33.3 25.7 q- 0.3 25 26.1 4- 0.4 25 Isopropyl 33.44-0.4 33.3 24.7 q- 0.45 25 48.7 q- C.1 50 The fact that the results in Table I were not as accurate as expected was suspicious. It was not reasonable to expect the analysis for the Cs to be so much higher than those for C7, Co and C•0 aldehydes when all four com- pounds were presumably present in the same amounts. It was suspected that the Cs was the purest of the aldehydes used in the mixture, and, there- fore, that the actual Cs content should be slightly higher than any of the others. Figure 9 shows a purity determination of the C7 aidehyde. The im- purity indicated is not, as one might suspect, the Cs octyl aldehyde since the retention time is not quite right. The point is that the C7 aldehyde was impure and, therefore, the low analytical figure for this aldehyde is reasonable. The same thing applied to the Co aldehyde (Fig. 10), which has sonhe Cs impurity. This would decrease the analysis for Co and increase it for Cs. Finally, in Fig. 11, the C•o aldehyde can be seen to be a complex Figure 12.--Gas chromatography 2:1:1 mixture of methyl, ethyl and isopropyl benzoates. Figure 13.--Gas chromatography of 1:1:2 mix- ture of methyl, ethyl and isopropyl benzoates.

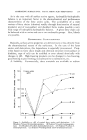
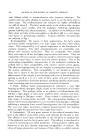
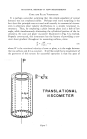
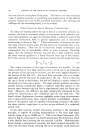
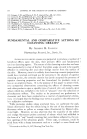
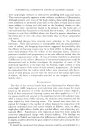
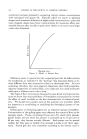
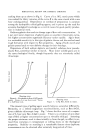
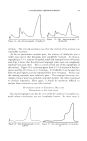
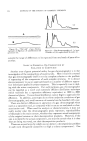
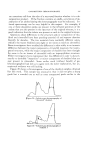
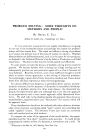
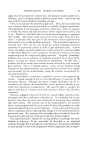
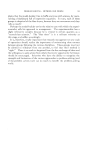
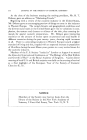
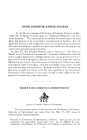
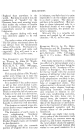
GAS-PARTITION CHROMATOGRAPHY 321 Figure 14.--Gas chromatography of rhodinol I. Figure 15.--Gas chromatography of rhodinol II. mixture. The over-all conclusion was that the analysis of the mixture was reasonably accurate. As far as quantitative analysis goes, the mixture of aldehydes was a rather easy case in that the peaks were completely resolved. In chroma- tographing a 1: 1: 1 mixture of methyl, ethyl and isopropyl esters of benzoic acid, Fig. 3 shows that the ethyl and isopropyl esters were not completely resolved from each other. This is a more critical test of the capabilities of the method. Figure 12 is a chromatogram from a 2: 1: 1 mixture of the ben- zoates and Fig. 13 is from a 1: 1: 2 mixture. In Table II, it can be seen that both the gross figures and the reproducibility were very good. In this case the starting materials were relatively pure. The isopropyl benzoate con- tained a trace of what was probably isopropyl alcohol the others contained no obvious impurities. Here again, it would be extremely difficult to analyze these mixtures by any other method. DIFFERENTIATION OF F•SSENTIAL OILS AND DETECTION OF ?tDULTERATION Gas chromatography can also be very useful for analysis of complex ma- terials whose constitution are not completely known. In these cases it Figure 16.--Gas chromatography of citro- Figure 17.--Gas chromatography of citronelllo nellol I. II.
Purchased for the exclusive use of nofirst nolast (unknown)
From: SCC Media Library & Resource Center (library.scconline.org)