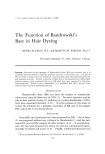
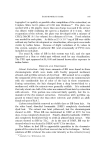
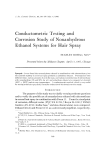
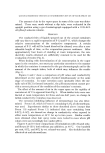
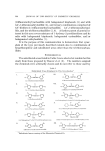
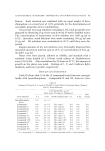
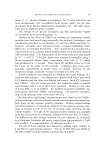
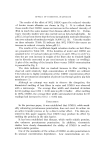
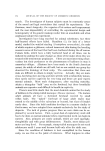
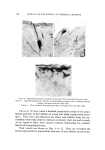
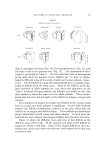
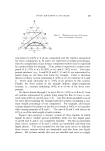
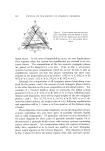
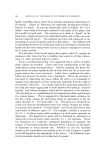
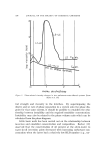
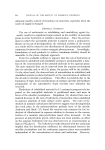
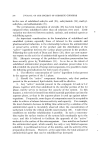
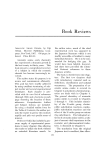
190 JOURNAL OF THE SOCIETY OF COSMETIC CHEMISTS Figure 2. Typical phase diagram for three pairs of partially miscible liquids in which fusion of the two liquid areas has resulted in the formation of a three-liquid phase region liquid phase. In the area of immiscibility, qrstu, the two liquid phases that separate when the system has equilibrated are referred to as con- jugate phases. The compositions of the two separate conjugate phases are joined on the diagram by a tie line. Thus, in Fig. 1, all ternary systems having gross compositions which lie on the tie line rt will, at equilibrium, separate out into two phases containing the three com- ponents in the proportions given by points r (10% w/w A 24% w/w ]3 66% w/w C) and t (12% w/w A 70% w/w ]3 18% w/w C). Although the compositions of all conjugate phases lying along rt are fixed by the points r and t, the amount of each conjugate phase relative to the other depends on the gross composition of the initial system. For example, if v (located midway along rt) represents the initial system prepared (11% w/w A 47% w/w B 42% w/w C) then, following equil- ibration and separation, there will be equal weights of the two conjugate phases, r and t. If w (11.SC•o w/w A 58.5% w/w B 30% w/w C) de- notes the initial system, the weight ratio of r to t following equilibration and separation will be 1:3 since w is three-quarters of the distance along rt from r. Phase diagrams of increasing complexity can be developed for ternary systems containing two and three pairs of partially miscible liquids and/or solid components. Of particular relevance to this discussion is the phase diagram for three pairs of partially miscible liquids, for it demonstrates a principle which occurs with ternary systems containing surface active agents. At a temperature where the regions of immisci- bility have expanded so as to touch one another, an inner triangular phase region appears on the ternary diagram. This situation is shown in Fig. 2 where the three two-phase regions (dekj, fglk, and hijl) encom-

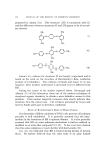
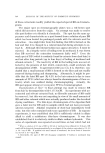
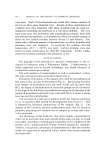
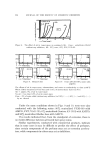
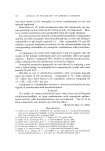
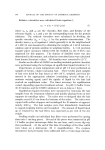
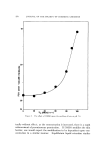
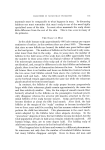
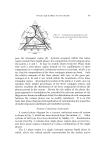
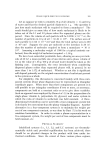
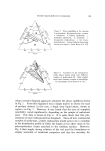
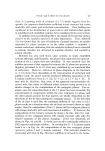
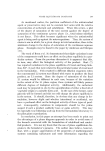
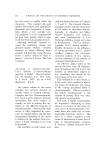
PHASE EQUILIBRIUM DIAGRAMS 191 80 60 40 20 water Figure 3. Typical phase diagram for a sur- factant-•vater-oil system Efro•n Dervichian (t)l pass the triangular region jkl. Systems prepared within this latter region contain three liquid phases, the composition of each being given by the points j, k and 1. It may be readily shown from the Phase Rule that such a three-phase region formed by the equilibration of three components in a condensed, isothermal system is invariant, which is to say that the compositions of the three conjugate phases are fixed. Only the relative amounts of the three phases will vary as the gross per- centages of A, B, and C are varied within the boundaries of the inner triangular region. Knowing the location of the points j, k and l, one can calculate these weight percentages of the three conjugate phases and thereby establish the distribution of all three components between the phases present in the system. Herein lies the utility of the phase dia- gram approach to formulation for, provided the relevant portions of the diagram are known in sufficient detail, the distribution of each component between the various phases can be readily calculated. It is on this basis that phase diagrams find application in rationalizing the properties of multicomponent solubilized and emulsified systems. Systems Containing Surfactants A typical phase diagram for a ternary surfactant-water-oil system is shown in Fig. 3, which has been derived from Dervichian (1). Other systems of this type have been described by Mulley (2). Examination reveals that Fig. 3 contains four single-phase regions plus several two- and three-phase regions composed of various combinations of the single phases. The L1 phase region is a single, isotropic aqueous liquid phase in which, above the critical micelle concentration for the surface active
Purchased for the exclusive use of nofirst nolast (unknown)
From: SCC Media Library & Resource Center (library.scconline.org)