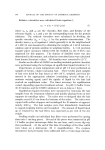
2O2 JOURNAL OF THE SOCIETY OF COSMETIC CHEMISTS adequate quality control of incoming raw materials, especially when the source of supply is changed. C•CAL STABm•TV The use of surfactants as solubilizing and emulsifying agents fre- uently results in a significant improvement in the stability of materials prone to either hydrolytic or oxidative deterioration. Since the environ- ment in which the susceptible molecule is placed exerts a profound in- fluence on its rate of decomposition, the chemical stability of the system as a whole will be related to the distribution of this potentially unstable component between the various conjugate phases present. Accordingly, formulation of such products to achieve maximum stability should be amenable to the phase diagram approach. From the available evidence it appears that the rate of hydrolysis of materials in solubilized and emulsified systems is predominantly a func- tion of the concentration of the unstable molecule in the aqueous phase. The more material that can be removed from the aqueous environment into the miceliar and/or oil (L2) phase, the greater will be the stability. On the other hand, the observed rate of autoxidation in solubilized and emulsified systems is related primarily to the concentration of oxidant in the oil and/or miceliar pseudophase. This effect is probably due to the formation of high, local concentrations of oxidant and this will facilitate propagation of the autoxidative chain reaction once initiation has occurred. Hydrolysis of solubilized material in L1 systems is progressively im- paired as the susceptible molecule is partitioned more and more in favor of the micellar pseudophase. Riegelman (14) showed there was a marked decrease in the rate of hydrolysis of benzocaine when solubilized in aqueous solutions of ionic surface active agents. The rates of hy- drolysis in nonionic surfactants did however suggest that decomposition also took place in the polyoxyethylene palisade layer of the micelle. Anderson and Slade (13) found the reaction rate constant for the hy- drolysis of chlorbutanol in aqueous solution to decrease as the concen- tration of a nonionic polyoxyethylene lauryl ether increased. In the presence of polyethylene glycol, which does not form micelies, no effect on the aqueous hydrolysis rate was observed even at concentrations as high as 10% glycol. The hydrolysis results obtained with the surfactant implied that the distribution coefficient for chlorbutanol between the miceliar pseudophase and the continuous aqueous phase was essentially independent of the concentration of solute and surfactant. However,

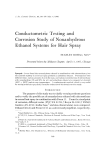
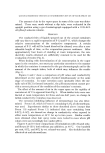
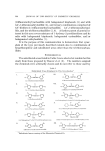
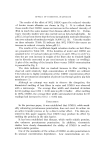
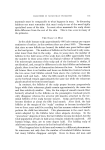
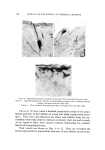
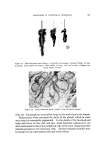
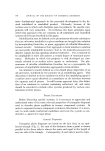
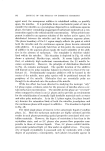
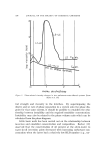
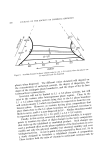
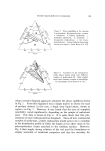
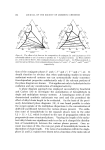
PHASE EQUILIBRIUM DIAGRAMS 203 there is a growing body of evidence (16, 17) which suggests that fre- quently the apparent distribution coefficient is not constant but varies markedly with solute and surfactant concentration. These findings are significant in the distribution of preservatives and antimicrobial agents in solubilized and emulsified systems, to be considered in the next section. In addition to the partitioning effect, the charge of the micellar surface relative to the catalytic species is of some importance. Thus, Mitchell (18) has shown that the rate of hydrolysis of propyl benzoate in equally saturated L1 phase systems is in the order cationic nonionic anionic surfactant, indicating that the catalytic hydroxyl ion is attracted to cationic micelies, not attracted to nonionic micelies, and repelled by anionic micelies. Mitchell has also used these same systems to study emulsified systems although, unfortunately, the phases that separated out upon sat- uration of the L1 phase were not identified. It was assumed that the additive in excess of that required to saturate the L1 phase was present as droplets, presumed to be L2, that were stabilized by an interfacial film of surfactant. However, reference to phase diagrams in the literature (1, 2, 19) shows that, depending on the concentration of surfactant and additive used, the phase systems produced following saturation of the L1 phase could have been L1 d- L2, L1 d- LC, or L1 d- L2 d- LC. It may well be, therefore, that some of the apparent inconsistencies ob- served were due either to different phase systems being present or to drastic changes in the compositions of the conjugate phases. For ex- ample, once the saturation limit of the L1 phase has been exceeded, the concentration of components within the now conjugate L1 phase, and the other phases present for that matter, are wholly dependent on the directions of the tie lines joining the conjugate phases. If the direction of the tie lines is such that the continual addition of, say, ester to a L1 phase results in a situation where the tie lines are crossed almost at right angles, then the composition of the L1 phase and its conjugate phase(s) will change markedly with each increment of additive. If, however, the compositions of the ternary systems lie along a tie line, then the com- positions of the conjugate phases will remain constant with only the relative amounts of the phases changing. These two situations are shown in Figs. 9A and 9B. In both cases an oil is continually added to a 30% aqueous surfactant solution. In crossing the L1 d- L2 phase region from b to c in Fig. 9A, the compositions of the two conjugate phases (given by points b and c) remain constant. This behavior should be contrasted with that in Fig. 9B where addition of oil leads to the forma-
Purchased for the exclusive use of nofirst nolast (unknown)
From: SCC Media Library & Resource Center (library.scconline.org)