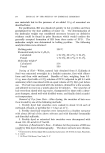
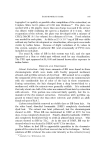
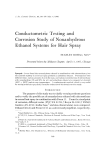
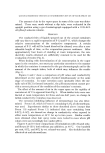
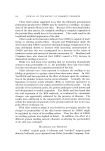
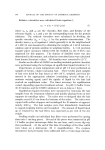
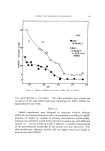
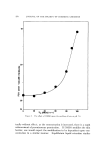
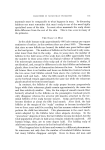
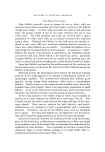
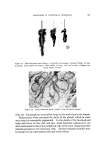
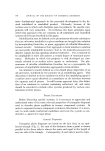
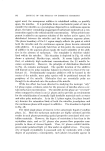
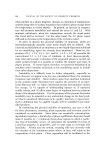
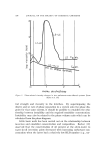
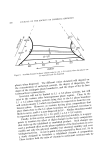
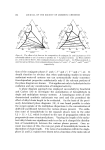
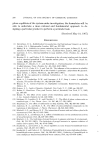
JOURNAL OF THE SOCIETY OF COSMETIC CHEMISTS L2.LC ,2 L1 *LC L2 C 8 ale. __o L2 C 4 ale. 1 0 1 2 3 moles alcohol/soap Figure 5. Phase-related viscosity changes in two surfactant-water-alkanol systems [from Hyde et ah (8)] ical strength and viscosity to the interface. By superimposing the degree and/or rate of phase separation in a system onto the phase dia- gram for that same system, it should be possible to establish the rela- tionship between instability and the required emulsifier concentration. Instability may also be related to the phase volume ratio which can be calculated from the phase diagram. Little basic work has been carried out on the relationship between inversion and emulsifier concentration and composition. Becher (12) observed that the concentration of oil present at the oil-in-water to water-in-oil inversion point decreased with increasing surfactant con- centration when the latter had a relatively low HLB number (e.g., sor-

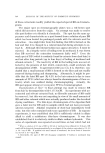
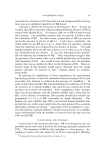
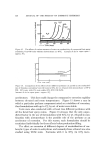
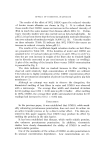
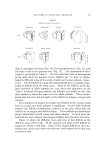
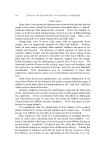
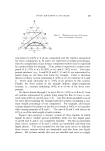
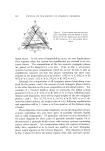
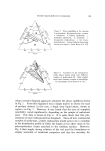
PHASE EQUILIBRIUM DIAGRAMS 1,q9 bitan monoesters). With the more hydrophilic polyoxyethylene deriv- atives, the water-in-oil to oil-in-water inversion point generally in- creased with increasing surfaetant concentration. Little correlation was obtained between surfaetant structure and the inversion point. There have been reports (12) dealing with different inversion points within a particular system which appear to depend on whether the change is induced by the addition of oil or water. These apparently anomalous results, obtained by the use of titration techniques, may simply arise from the systems being in an unequilibrated state when the data was obtained. A ternary phase diagram approach was employed by Salisbury et al. (13) to study the effect of apparent phase volume ratio on inversion and emulsion type. In the particular system examined, an oil-in-watei dispersion was produced when 45•c or more water was present. Less than 45% water resulted in the formation of water-in-oil dispersions. The term "apparent" in relation to phase volume ratio is used delib- erately. For example, in an L1 + L2 phase system, should the emul- sifying agent be present in excess of the concentration necessary to form an interfacial monolayer, then micelles will be present in both phases, and some solubilization will occur. The two phases will not therefore be Fure water and pure oil, as is frequently assumed consequently, the "true" phase volume ratio may be significantly different from that cal- culated on the basis of total water and oil present. A simple example is illustrated in Fig. 6. The gross composition of the system originally prepared is surfactant (20% w/w), water (40% w/w), and oil (40% w/w). Such a system is represented by point q. The apparent phase volume would be 0.5, if we assume the oil to have a density of 1. By allowing the system to come to equilibrium, the two separate conjugate phases would have the compositions denoted by p (23% w/w surfac- tant, 14% w/w oil, and 63% w/w water) and r (16% w/w surfactant, 7,5% w/w oil, and 9% w/w water). Calculations based on the dis- tances pq and qr show that for each 100 g of total system there would be 57.4 g of L1 and 42.6 g of L2--a "true" phase volume of almost 0.44. On dispersing one phase within the other to achieve emulsification then, as discussed earlier, something like 1-1.,5 g of surfactant would migrate to the interface, shifting the compositions of the L1 and L2 phases to somewhere in the vicinity of p' and r'. This system has a phase volume of 0.42. It is therefore possible to have three phase volume ratios---that from total oil to total water, that from the con- jugate phases when separated, and, finally, that from the conjugate
Purchased for the exclusive use of nofirst nolast (unknown)
From: SCC Media Library & Resource Center (library.scconline.org)