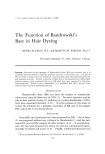
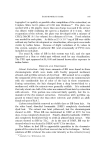
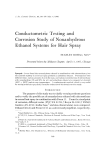
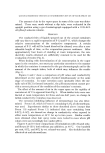
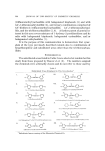
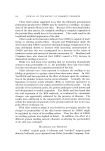
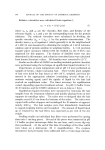
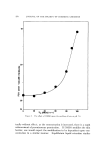
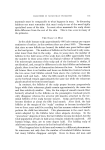
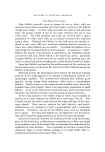
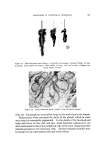
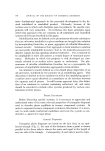
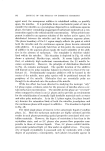
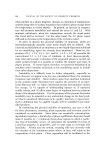
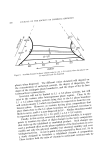
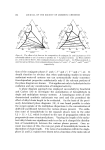
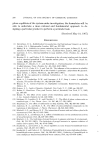
200 JOURNAL OF THE soCIETY OF COSMETIC CHEMISTS \ / / / q L•.L2 2O 4O 80 60 • water Figure 6. Possible changes in phase volume ratio in a L1 4- L2 system when the phases are (a) separated and (b) dispersed phases when dispersed. The different ratios obtained will the concentration of surfactant present, the degree of dispersioonthelinestiedependtheof slopes of the coniug ate phase boundaries, and the slopes between these various phases. Inversion will not be limited to L1 q- L2 phase systems, will exist in the various other heterogeneous phase regions. Thus, L1 q- LC phase region, systems lying close to the L1 phase boundat•s.thetha.con-inthebut will contain mostly L1 which can therefore be expected to form ß s having gross compos. itions. . _ However, as syste. m .__ duced, mvers•on tmuous phas.e. , • base boundary are pr.o. .- -.. ....... uld ce hem close to the LC p ....... A .,• 1. Similar sttuauot• lP.• 1 •o occur, andL1 isnow a, spe•'• .... C. LCregions. Y be expected to exist in the L2 q- LC and L1 q- L2 q- Finally, in this section concerned with physical stability, priate to mention the effect of slight changes in the basic that make up the solubilized or emulsified product. Such exert a profound effect on the phase equilibria of the final as modify not only the physical stability but chemical stability biological activity. A case in point is that reported by Boon al. a study designed to formulate a solubilized vitamin These workers held the ratio of vitamin to surfactant constanbyand,preparaineventocan(6)soandetchangecompoappro-isitAsystem

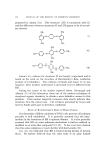
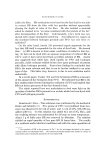
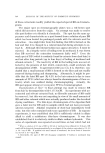
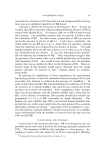
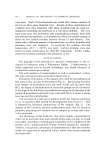
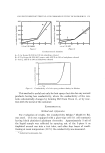
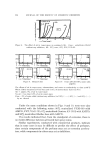
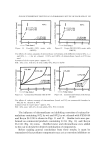
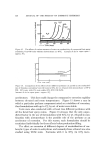
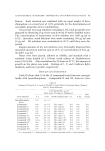
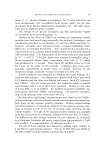
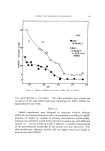
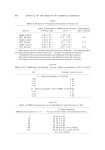
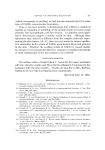
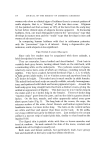
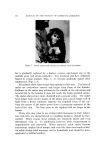
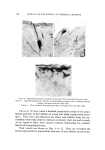
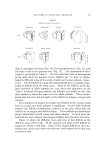
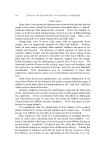
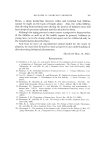
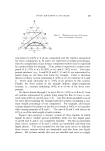
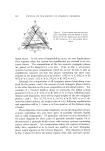
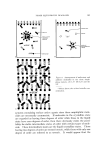
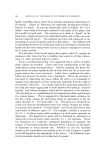
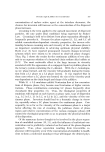
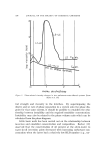
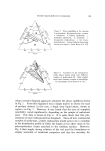
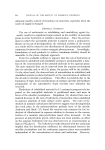
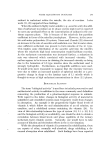
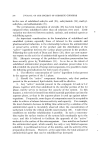
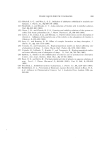
PHASE EQUILIBRIUM DIAGRAMS •C, • 8•20 •• o a 80 60 40 20 water Figure 7. Phase equilibria in the vitamin A-polysorbate 80-glycerol-water system. a, emulsions b, faintly opalescent c, markedly opalescent d, semisolid e, transparent single-phase f, two trans- parent phases. Arrows indicate decreasing viscosity in region e [from Boon et al. (6)] 201 ...e 8 20 80 60 40 20 water Figure 8. Variations in the transparent single phase region using four different samples of polysorbate 80. Only shaded areas were common regions of miscibility for all samples [from Boon et al. (6)] using a ternary diagram approach, obtained the phase equilibria shown in Fig. 7. From this diagram it was a simple matter to choose the type of product desired, in this case, a single clear liquid phase, shown as region e in Fig. 7. However, it was found that the area of complete miscibility varied significantly, depending on the sample of surfactant used. This data is shown in Fig. 8. It is quite likely that this phe- nomenon is more widespread than imagined. Since all were commercial samples of surfactant, a likely explanation would seem to be a variation in the distribution profile of either the length of the alkyl chain or the polyoxyethylene chains attached to the sorbitan nucleus. However, Fig. 8 does supply strong evidence of the real need for formulators to employ materials of consistent properties and also the necessity for
Purchased for the exclusive use of nofirst nolast (unknown)
From: SCC Media Library & Resource Center (library.scconline.org)