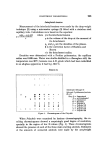
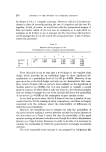
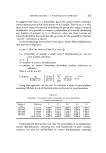
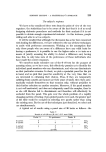
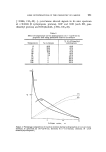
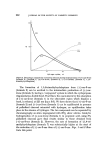
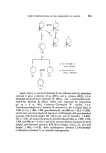
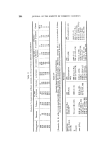
SENSORY TESTING -- A STATISTICIAN'S APPROACH 217 he suggests that there is a probability (p) of the panel member making a correct sensory perception of the nature of the sample. Thus in an n+n test, there is a pn chance of correctly identifying the group of n using a binomial distribution, it is possible to compute probabilities of correctly identifying any number of samples up to n. However, when less than n items are correctly identified, the model has also provision for the possibility of further "correct" selections by chance. In the terminology used earlier in this paper, which differs slightly from that used by Gridgeman: n+m=t (For the cases inTablelI, n=m=•) p= probability of making a single correct identification (i.e. not by pure random selection) q=l -p x----number of correct identifications r----number of correct allocations (including random selections in addition) Then tm•r•x•0 P (r m)= m! (t-m) ! (m-x) ! x (t-2m+r) ! (m-r) ! ' (t-x) !x! P q X•O Using this approach, we are able to calculate a series of probabilities assuming different levels of discrimination on the part of panel members. Table III. Probability of completed correct allocation for given probability of basic discrimination. Nature of Response test 2+2 test 2 correct 3+3 test 3 correct 4-t-4 test 4 correct 5+5 test 5 correct 6-t-6 test 6 correct 5 & 6 correct 0 0.1 0.5 0.9 1.0 0.330 0 0.340 0 0.500 0 0.873 4 1.000 0 0.100 0 0.104 8 0.268 8 0.792 6 1.000 0 0.028 6 0.031 1 0.146 4 0.717 7 1.000 0 0.007 9 0.009 1 0.079 2 0.648 8 1.000 0 0.002 2 0.002 8 0.042 4 0.585 7 1.000 0 0.077 9 0.086 7 0.325 6 0.934 8 1.000 0 From TableHi then weshow not only the probability of an individual's correct discrimination, assuming the null hypothesis of pure random selection, but also the probabilities of correct discrimination assuming

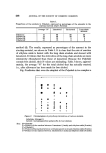
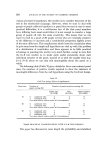
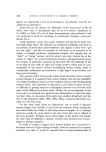
218 JOURNAL OF THE SOCIETY OF COSMETIC CHEMISTS various alternative hypotheses this enables us to consider the power of the test in the statistician's language. However, when we start to deal with groups of people collected together in a panel then we start at once to meet practical ditticulties it is a well-known fact of life that panel members have differing basic nasal sensitivities it is not enough to consider a large group of people all with the same sensitivity. This means that we can expect to find in a panel of 30 people several who are extremely sensitive to the difference in question and a considerable proportion slightly aware of the same difference. The complications which beset the statistician when he gets away from the simple null hypothesis are tied up with this problem of a distribution of sensitivities and there appears to be little practical advantage in pursuing this matter very much further, except to note that the 6+6 test enables us to make quite useful statements about each individual member of the panel, instead of as with the smaller tests (e.g. 2+2, 3+3) where we can only talk meaningfully about the panel as a whole. The following table (Table I V) gives details for three conventional panel sizes, the numbers of positive results required to show the existence of meaningful differences from the null hypothesis using the 6+6 test design. Table IV. 6-t-6 Test design (Tests of significance) Panel size Number of panel scoring 6/6 Number of panel members scoring 5/6 Fairly sure Sure Almost certain (P 0.05) (P0.01) (P0.001) 10 0 combined with 4 4 6 1 combined with 0 2 3 2 or more almost certain under all circumstances 20 0 combined with 5 6 8 1 combined with 2 4 6 2 or more almost certain under all circumstances 30 0 combined with 7 8 10 1 combined with 3 5 7 2 combined with 0 0 4 3 or more almost certain under all circumstances SOME PRACTICAL CONSIDERATIONS WITH N+M TEST DESIGNS This paper has discussed at some length the probability and statistical
Purchased for the exclusive use of nofirst nolast (unknown)
From: SCC Media Library & Resource Center (library.scconline.org)