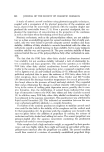
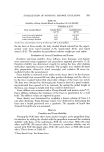
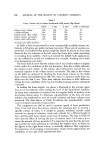
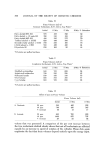
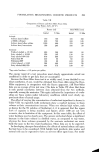
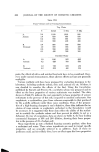
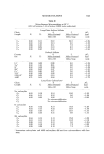
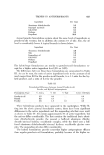
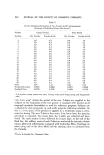
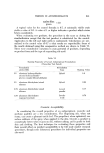
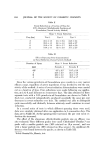
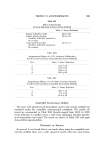
596 JOURNAL OF THE SOCIETY OF COSMETIC CHEMISTS Table I Foam Volumes (ml) of Anionic Surfactants, 0.2% Active, Tap Water * Initial 2 Min 5 Min 2-Min % Retention Sodium lauryl sulfate 975 765 705 a-Olefin sulfonate 930 755 750 Sodium lauryl ether sulfate 1030 830 800 Sodium lauroyl sarcosinate 330 230 205 Sodium alkyl sulfoacetate 870 680 650 78 81 81 70 78 a6.5 grains per gallon hardness. In Table I, data are presented for some 'commercially available anionic sur- factants in 6.5 grains per gallon hardness tap water. Three sets of numbers are presented. It is believed that greater emphasis should be placed on foam data shown in the two columns on the left, since the 5-min data, while interesting in revealing foam stability, which is of interest for bubble bath applications, are not reflected in actual use conditions (for example, brushing one's teeth or in shampooing one's hair). The foam data do show that the sodium salt of lauryl ether sulfate is slightly better, under the conditions of this test procedure, than the rx-olefin sulfonate, the sodium lauryl sulfate, or the sodium alkyl sulfoacetate and all four are markedly superior to the sodium lauroyl sarcosinate. The data in the column on the right are obtained by dividing the 2-min foam volume by the initial foam volume and multiplying by 100. This value is a measure of the foam sta- bility over the first 2 min. These data indicate that there is little difference among the foam stabilities of the top four leading foaming anionic surfactants evaluated. In reading the foam heights, one places a fingernail at the average upper foam level immediately while reading the level of the liquid/foam interface. At times some estimation is required due to irregular levels of pockets of air developing during aging. To determine reproducibility of the data, the same solution was transferred to each of several cylinders and foam volumes were measured. The data shown in Table II indicate the reproducibility which may be obtained using this test procedure. This equipment can also be used to measure speed of foam production. Thus, if one had set as his primary criterion the minimum time to develop a specific volume of foam, it is simple to prepare solutions, transfer equal amounts to a group of cylinders, rotate each cylinder for a different length of time, and then plot foam volume versus time of rotation. The data in Table III show that the effect of varying the time of rotation from i to 5 min is to in- crease the amount of foam generated. It is important to note that the percent- age increase for each surfactant in extending the rotation time, as shown by the figures in the right hand column, is markedly different. This emphasizes the importance of developing a test procedure which closely approximates use conditions, so as to get valid experimental data.

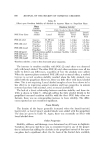
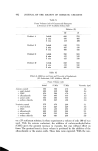
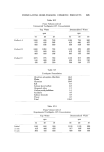
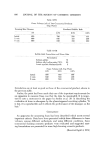
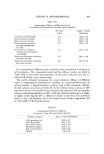
FOBMULATING HIGH-FOAMING COSMETIC PBODUCTS Table II Beproducibility of Foam Data (Foam Volumes, ml, at 26 rpm) 597 Compound A Average Initial 625 625 630 640 630 630 ___ 12 2 minutes 460 460 470 490 470 470 ___ 25 5 minutes 440 440 450 470 440 450 ___ 26 Compound B Initial 620 630 640 630 630 ___ 14 2 minutes 505 480 495 480 490 ___ 21 5 minutes 450 450 475 450 455 ___ 22 Table III Foam Volumes (ml), with Increasing Rotation Time Time (rain) i 2 13 4 5 % Increase Compound A Initial 330 370 440 430 460 39 2 minutes 230 265 285 305 320 39 5 minutes 205 250 280 290 300 46 Compound B Initial 520 530 630 800 900 92 2 minutes 365 355 460 640 690 89 5 minutes 305 320 440 600 640 110 If one were concerned with flash foam, the cylinder could be rotated for iust a few seconds and a series of photographs taken immediately to capture the data permanently. Those questions concerned with foam texture could also be answered with a series of photographs. A group of commercially avail- able high-foaming nonionic surfactants was then selected and foam data were measured by this procedure. The data are shown in Table IV. It is obvious that the foam volumes of the best nonionic surfactants do not approach those of the best anionic surfactants, shown previously. Again, the 2-min foam stability is shown by the value in the column on the right. In addition, a few amphoteric surfactants were evaluated in a similar fashion, as shown in Table V. The best amphoterics give foam volumes inter- mediate between the best anionic and the best nonionic surfactants. Although the equipment was set to run at 30 rpm with an empty cylinder, with a load of 200 ml of solution in the cylinder, a speed of only 26 rpm developed. The ef- fect of varying the speed, by adjusting the transformer setting, is shown in Ta- ble VI. As expected, the greater the rpm of the cylinder, the higher the foam
Purchased for the exclusive use of nofirst nolast (unknown)
From: SCC Media Library & Resource Center (library.scconline.org)