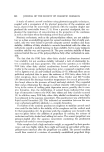
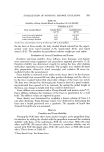
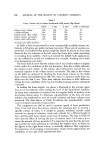
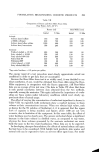
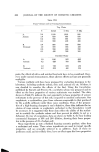
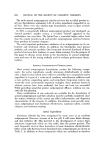
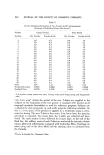
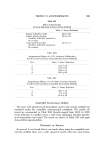
598 JOURNAL OF THE SOCIETY OF COSMETIC CHEMISTS Table IV Foam Volumes (ml) of Nonionic Surfactants, 0.2% Active, Tap Water" Initial 2 Min 5 Min 2-Min % Retention Fatty alcohol 60% EO 570 Fatty alcohol 4- 12 mole EO 350 Fatty alcohol 60% EO 490 Tridecyl alcohol 4- 15 EO 620 Secondary fatty alcohol 4- 9 EO 700 t-Octyl phenol 4- 9 EO 560 Polysorbate 80 230 465 390 82 310 185 89 385 375 79 480 300 78 530 100 76 455 420 81 100 50 44 "6.5 grains per gallon hardness. Table V Foam Volumes (ml) of Amphoteric Surfactants, 0.2% Active, Tap Water" Initial 2 Min 5 Min 2-Min % Retention Modified cycloimidine 840 705 685 84 Substituted imidazoline 700 585 550 85 Sulfonated amide 530 385 330 73 O]eyl betainc 500 335 350 77 Coco betainc 860 705 650 82 a6.5 grains per gallon hardness. Table VI Effect of rpm on Foam Volume Foam Volume (ml) Initial 2 Min 5 Min A. Nonionic B. Anionic 20 rpm 500 400 295 40 rpm 700 450 345 % increase 40 13 17 20 rpm 800 700 600 40 rpm 1000 855 795 % increase 25 22 32 volume that was generated. A comparison of the per cent increase between the two surfactants studied clearly shows that not all surfactants are affected equally by an increase in speed of rotation of the cylinder. These data again emphasize the fact that foam volumes depend entirely upon the energy input.

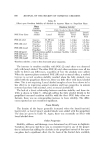
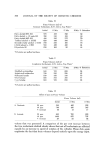
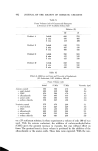
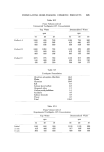
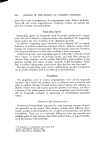
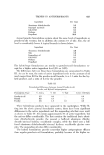
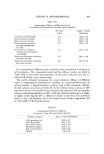
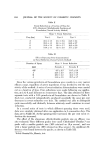
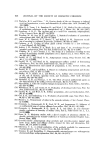
FORMULATING HIGH-FOAMING COSMETIC PRODUCTS 599 Table VII Comparison of Bacon and Ross-Miles Foam Data (Tap Water, 0.2%, 38 ø C •) Bacon (ml) Ross-Miles (mm) Initial 5 Min Initial 5 Min Anionic Sodium lauryl sulfate 975 705 170 150 c•-Olefin sulfonate 930 750 160 145 Sodium lauryl ether sulfate 1030 800 170 140 Sodium lauryl sarcosinate 350 205 105 20 Nonionic Tridecyl alcohol q- 15 EO 620 300 160 80 Fatty alcohol q- 12 EO 350 185 130 20 Fatty alcohol 60% EO 570 390 110 80 Polysorbate 80 230 50 50 40 Poloxamer 237 150 9,5 110 85 t-Octyl phenol q- 9 EO 560 420 140 30 Fatty alcohol 60% EO 490 375 100 45 •Tap water hardness = 6.5 grains per gallon. The energy input of a test procedure must closely approximate actual use conditions in order to get data that are meaningful. Because the Ross-Miles foam test is so widely used, it was decided to see what correlation, if any, would be obtained from foam data using the Ross- Miles equipment, in comparison with the Bacon apparatus. (All Ross-Miles data are an average of two test runs.) The data in Table VII show that there is only partial correlation between data obtained from the two methods, especially among the nonionics. This again indicates the importance of evalu- ating any foam system under laboratory conditions which most closely ap- proximate those of actual usage. The effect of varying the concentration of surfactant ingredient is shown in Table VIII. As expected, both surfactants show a marked increase in foam volume as their concentrations increase. When one obtains high values, such as shown for the 5% solution of Surfactant A, it is apparent that the upper limit of capacity is being reached, and figures above 1100 are not very accurate, due to limitation of the equipment. In this same table, the effect of water hardness may be clearly seen. The anionic surfactant shows a significant increase in the foam volume in distilled water, as compared to tap water, whereas the foam volumes generated by the nontonic surfactant are essen- tially the same in the two water hardnesses. These data are to be expected. In developing shampoo formulations, the effects of natural sebum soil upon the hair have to be considered. With bubble bath products, skin wastes and natural soils can be expected to have an adverse effect upon foam. For tooth-
Purchased for the exclusive use of nofirst nolast (unknown)
From: SCC Media Library & Resource Center (library.scconline.org)