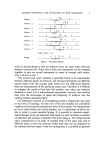
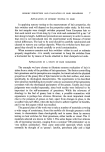
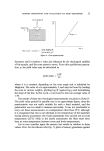
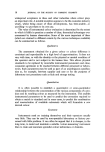
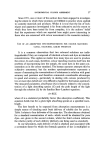
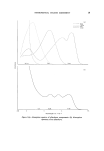
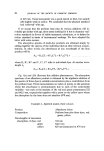
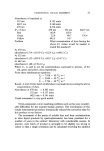
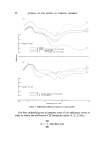
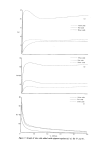
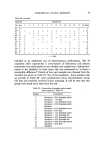
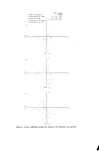
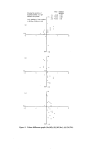
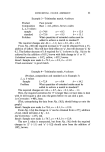
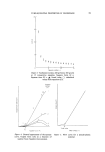
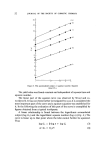
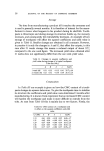
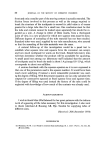
26 JOURNAL OF THE SOCIETY OF COSMETIC CHEMISTS (o) division: I% AR • \ -\ // ........ _, • .•.. ............ A: Sample ........................ B: Sample +1-0 Kg brown and 1.0 Kg yellow ........... C: B +1.0 Kg brown , ............ D: C +1.0 Kg base and 1.0 Kg yellow -- I division =1% AR ........... E: D +0.5 Kg brown ond 1.0 Kg yellow ........... F: E +0-5 Kg yellow :3.5 4 5 6 7-5 Wavelength nm x 10 -• Figure 5. Differential reflectance spectra of a face powder. Our first undertaking was to integrate some of our reflectance curves in order to obtain the well-known CIE tristimulus values X, Y, Z, thus' X = 700 Z 4OO

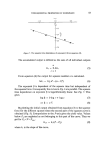
INSTRUMENTAL COLOUR ASSESSMENT 27 700 4OO g • 700 4OO Where light having energy E(L) is incident upon a surface having reflectance R(L) and x, y, z are the CIE spectral distribution curves for normal vision. These tristimulus values locate the colour as a point in colour space and we found invariably that the location so calculated was consistent with the colour measured. However, the task of performing the calculation was formidable and had to be given to our computer. We then examined a number of 'abridged spectrophotometers' which function by replacing the usual prism or grating by filters designed to correspond to the three CIE spectral distribution curves and so measure X, Y and Z directly. Thus having simplified the procedure for plotting the position of objects in colour space, we began to compute the small differences between co- ordinates of standard and corresponding production samples for various products. We found that even the smallest visually perceptible colour difference was detectable by the spectrophotometer, but that the exact interpretation of such differences and the assessment of what ought to be done to reduce them was difficult. There were two reasons for this: Without an accurate coloured model of CIE colour space, two sets of co-ordinates give very little indication of the nature of the visual colour difference between them. CIE colour space is not uniform with respect to just perceptible colour differences. The eye, for example, detects a far greater colour difference for a given co-ordinate difference in the blue region than for the same co- ordinate difference in the green region. Fortunately, these two difficulties have long been recognized by workers who, like us, felt the need for 'appearance scales' rather than the 'colour- specifying scales' of the CIE. Alternatives to the CIE system, known as Uniform Colour Scales, began to appear soon after the adoption of the CIE Standard Observer data. Designers of UCS systems transformed these data by means of equations in order to create scales having the following desirable properties:
Purchased for the exclusive use of nofirst nolast (unknown)
From: SCC Media Library & Resource Center (library.scconline.org)