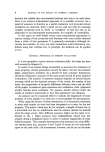
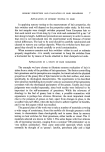
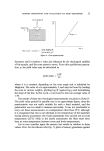
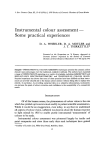
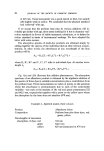
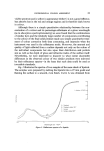
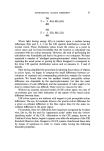
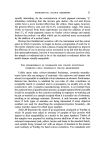
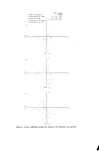
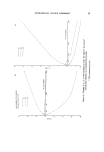
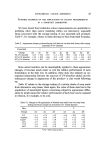
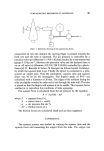
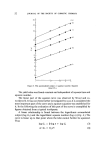
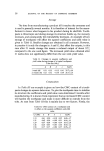
SENSORY PERCEPTION AND EVALUATION OF HAIR GREASINESS 5 Assessor I Assessor Assessor Assessor 4 Assessor 5 Assessor 6 Assessor 7 Assessor 8 D C MB c D O ø- C M B M ½ A O C M B A 12' I I D B M C A D C M B A % C M B A Higher values Average O C M B A o- Figure I. The meter method. scale by standardizing so that all assessors have the same mean (M) and standard deviation (c 0. When this is done, all assessments can be averaged together to give an overall assessment in terms of average scale values. This is shown in Fig. 1. The overall rank order obtained is generally found to be reproducible between different panels of assessors, but because individuals use different mental scales both the average scale values and the differences between them are characteristic of the particular panel used. Therefore it is difficult to compare the results of one test with another, even when one common standard is used. For a self-contained experiment, however, this method does have the advantages of speed and simplicity of analysis over the ranking method described below. An alternative method of investigating property magnitudes uses data in the form of rankings. At least two of the test samples are considered together and the assessor indicates the order of the samples. He will generally go on to rank further sets of test samples, up to a maximum of about ten sets in order to avoid panellist fatigue. It is possible to construct experi- mental designs which are balanced with respect to such variables as number of replicates and position of samples before the assessor. The design should allow comparisons to be made of samples both of the same type and of different types, so that the variance within each type can be compared to the variance between types. From the ranking data it is possible to generate

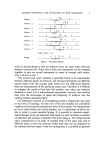
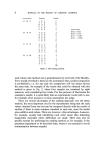
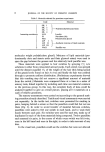
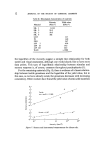
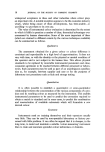
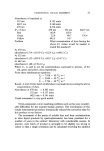
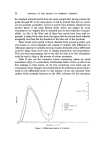
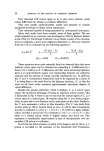
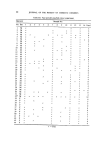
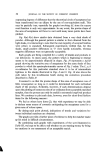
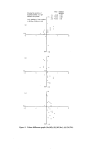
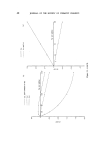
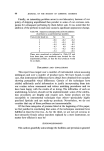
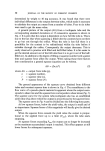
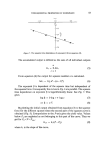
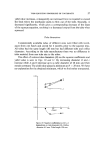
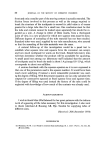
6 JOURNAL OF THE SOCIETY OF COSMETIC CHEMISTS Presentation Ranking Number A B C A B C 2 A C B 2 B A C 2 B C A I C A B I C B A 0 B A D A B D 3 A D B 2 B A D 2 B D A I D A 8 0 D B A 0 C D A A c D 3 A D C 2 C D A 2 C A D I D A C 0 D C A 0 D C B B C O 2 B D C I C D B I C B D 2 D B C I D C B I I 32 Scale values 4,/( A ): 0.63l M(B) = 0-072 M( C ) = -0-067 M( D ) = -0.636 Figure 2. The ranking method. scale values. Our method uses a generalization by Levitt (2) of the Bradley- Terry model (3) which is based on the assumption that a paired comparison is probabilistic, i.e. for any pair the comparison will not always favour the same item. An example of the results that could be obtained with this method is given in Fig. 2, where four samples are examined by eight assessors, each considering four triads. For the purposes of illustration the example is simple it is quite likely that an experimenter would wish to use, for example, more assessors or more assessments per judge. There are several advantages of the ranking approach over the meter method, the most important one for the experimenter being that the scale values obtained from one test can be compared directly with the results of another if there is some common standard in each test, since the model gives additive scale values. There are, however, other advantages. Assessors, for example, usually find identifying rank order easier than indicating magnitudes especially where differences are small. There may also be specific reasons for preferring the ranking method as, for example, in the greasiness experiment to be described later, where it was essential to avoid contamination between samples.
Purchased for the exclusive use of nofirst nolast (unknown)
From: SCC Media Library & Resource Center (library.scconline.org)