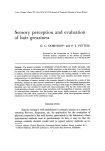
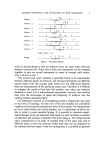
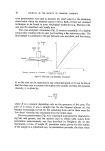
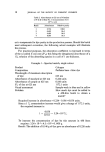
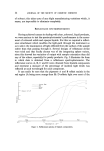
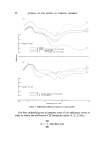
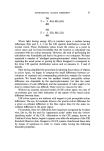
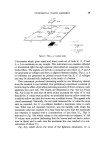
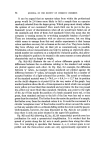
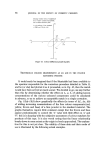
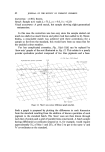
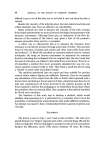
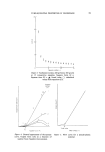
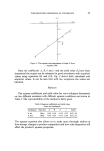
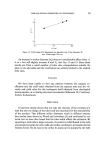
28 JOURNAL OF THE SOCIETY OF COSMETIC CHEMISTS They distorted CIE colour space so as to give more uniform visual colour differences for similar co-ordinate differences. They were readily understandable, usable and relatable to visually recognized attributes of object colour appearance. They remained capable of being measured by instrumental techniques. Many such scales have been created, none of them perfect. The one which appealed to us, however, was developed in 1958 by Richard Hunter in the USA (1). The Hunter Uniform Colour Scales consist of two chroma- ticity co-ordinates, a and b and a lightness dimension, L. They are obtained from the CIE co-ordinates via the following equations: 175 (x%-r) 70 (r-Zro) L-- 10x/•- a = b = L L (X% = 1.02X Z% = 0.847Z) These equations arise quite naturally from the observed facts that more uniform colour space can be obtained on expanding X-Y differences by a factor of 2.5 relative to Z-Y differences and that when measuring lightness, there is an approximately square root relationship between our subjective response and the amount of energy actually reaching the eye. In addition, the 'a' and 'b' chromaticity dimensions need to be expanded by a factor of 7 to bring them to the same level as the lightness function, 'L', so that the units on all three scales represent approximately equivalent degrees of visual difference. Besides the greater uniformity which it displays, L, a, b colour space enjoys the enormous advantage of being an opponent colour system. This is illustrated in Fig. 6 where it can be seen that the central region of L, a, b colour space is a neutral grey. Movement along the 'a' axis leads progres- sively to pure red in one direction and to pure green in the other. Similarly, the 'b' axis represents a yellow to blue transition. The 'L' axis leads from neutral white at 100 to neutral black at zero. It will be clear immediately that the co-ordinates L= 63.5, a= + 11.9, b = + 35.3 refer to a light, reddish- yellow and that a second set of co-ordinates L = 61.7, a-- + 12.3, b = + 35.3 refers to a related colour which is slightly darker and more red. This represents a considerable improvement in ease of interpretation over un- modified CIE colour co-ordinates. Proof that the third criterion of useful UCS design is met by the L, a, b system is provided by the existence of the Hunterlab D25 Tristimulus

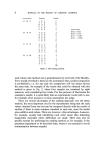
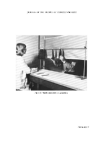
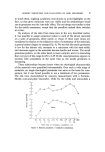
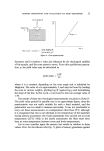
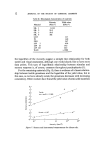
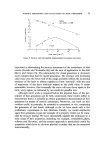
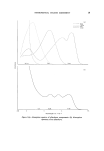
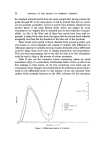
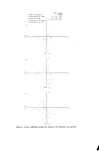
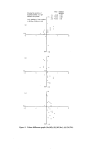
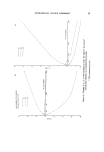
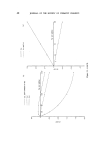
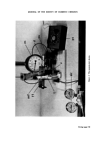
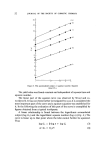
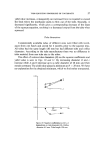
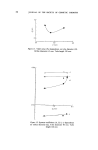
INSTRUMENTAL COLOUR ASSESSMENT 29 L=O Figure 6. The L, a, b colour solid. 0 -- I7'5 (1'02 X-Y) b : 7 (F-O'847Z) Colorimeter which gives rapid and direct read-out of both .Y, Y, Z and L, a, b co-ordinates on any sample. This instrument can examine reflected or transmitted light through separate photodetectors equipped with tristi- mulus filters. The signals are fed into a measuring unit where .Y, Y and Z are generated as voltages and fed to a digital voltmeter display. The L, a, b co-ordinates are generated by printed circuits from the .Y, Y, Z voltages and may be alternatively displayed at the touch of a button. This instrument produced interesting results in our laboratory almost from the moment it was installed. Our preliminary experiment consisted of monitoring the effect of grinding increasing amounts of three common oxide pigments into pure talc. The results are illustrated in Fig. 7(a)-(c). From Fig. 7(a) it can be seen that all three oxides increased the value of 'a' and that all the 'a' values were positive we concluded that the yellow oxide was a reddish-yellow and that the brown was a reddish-brown. This agreed with visual assessment. Naturally, the red oxide increased the 'a' value the most and, as expected, the 'a' co-ordinate reached a maximum value in each case. What was not expected, however, was the rapidity with which the maximum value was reached. It is clear from the curve that the maximum hue intensity is reached with a concentration of less than 5}/o . This is mirrored in Fig. 7(b) which relates to the yellow-blue co-ordinate, 'b'. All 'b' values were positive (indicating that the brown and red had a yellow tone in them) and in each case the maximum hue was reached at a con- centration of about 5•o. Fig. 7(c), which shows the trend of the lightness dimension, 'L', is
Purchased for the exclusive use of nofirst nolast (unknown)
From: SCC Media Library & Resource Center (library.scconline.org)