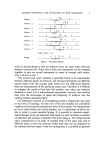
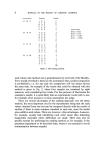
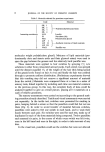
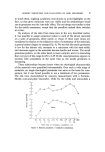
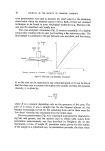
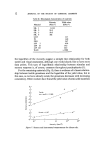
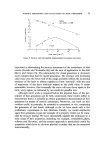
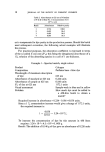
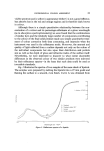
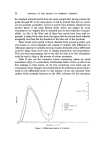
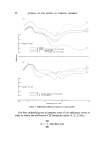
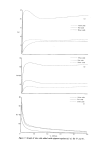
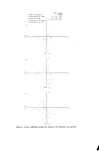
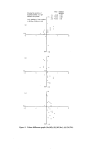
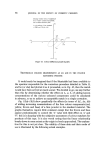
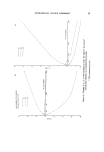
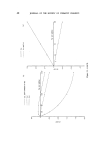
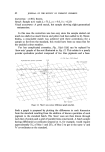
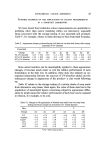
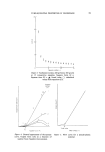
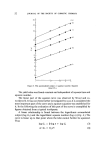
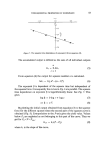
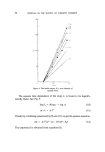
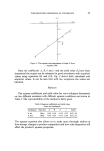
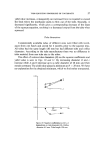
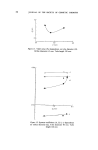
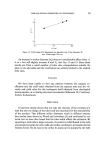
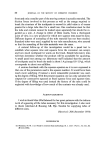
36 JOURNAL OF THE SOCIETY OF COSMETIC CHEMISTS expressing degrees of difference that the theoretical circle of acceptance has been transformed into an ellipse by the use of non-equivalent radii. This may be partially true, especially for graphs involving AL since the square root function is only very approximate. In any event, the precise shape of the area of acceptance will have to wait until many more points have been plotted. Fig. 9(a)-9(c) show similar data obtained from a very dark shade of powder. Although the general pattern is similar to that obtained from the light shade, it is interesting to note that the vast majority of accepted batches were yellow to standard. Subsequent experiments verified that, for this shade, small positive differences in 'b' were hardly noticeable, whereas negative differences were not generally acceptable. Such graphs are being compiled for a variety of shades and products in our laboratory. In many cases, the pattern which is beginning to emerge seems to be approximately ellipsoid in shape. Fig. 10 represents a Aa/Ab graph showing the tentative area of acceptance for the same shade of face powder to which the spectrophotometric curves of Fig. 5 relate. The L, a, b co-ordinates for this particular standard show it to be of intermediate lightness to the shades illustrated in Figs. 8 and 9. Fig. 10 also shows the path taken by this troublesome batch during the correction procedure described in Table H. It seemed to us that the precise shape of the area of acceptance was of little consequence so long as it could be determined for each individual shade of the product. Evidently, however, if such determinations depend upon the plotting of numerous sets of co-ordinates from acceptably matched samples, then the process can only be useful in extremely long-lived product lines. We continue to plot such data, however, even for short-lived fashion items for the following reasons: We feel as others have done (2), that with experience we may be able to deduce some means of correctly anticipating the acceptance zone for a given area of colour space. By dating each point plotted, indications of trends and variations be- tween individual matchers are obtained. The graphs provide a further piece of evidence to help the matcher make up his mind in difficult circumstances. By combining such graphs with experiments of the sort illustrated in Table III, we hope to be able to tell whether we are wasting money by being too cautious in our assessment of an acceptable match.

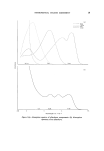
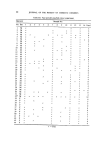
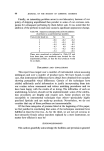
(a) L•b Showing the positions of accepted batches of a light coloured face powder. L,o,b readings of the standard L :54'0,0: + 11.6,b= + 14.9 e o -I Mean Standard deviation AL -008 0.57 16 Ao +002 0-28 Ab +0.50 0.21 -I.B AL -2 (b) o o 1.4 I eo Ao -I'• AL -2 (c) 1.4 I o o eo -I 6b -I 6 Figure 9. Colour difference graph (Aa/Ab) (b) (AL/Aa) (c) (AL/Ab).
Purchased for the exclusive use of nofirst nolast (unknown)
From: SCC Media Library & Resource Center (library.scconline.org)