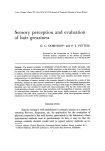
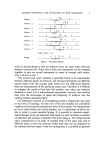
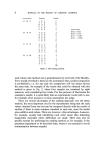
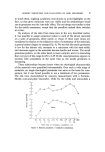
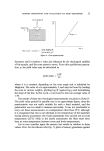
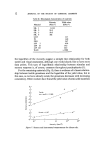
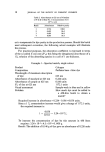
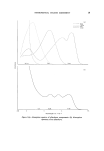
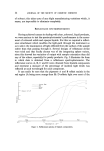
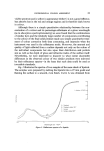
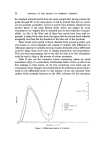
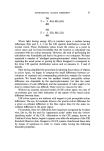
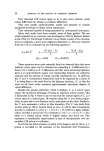
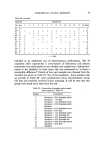
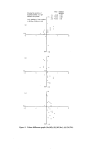
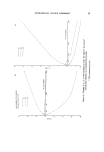
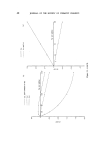
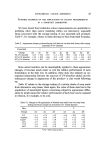
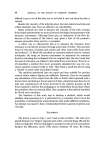
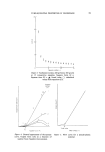
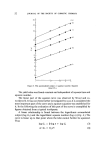
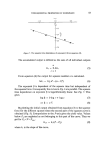
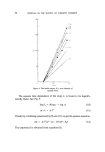
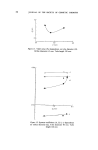
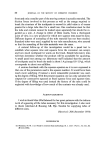
34 JOURNAL OF THE SOCIETY OF COSMETIC CHEMISTS It can be argued that an operator taken from within the professional group would be 2.4 times more likely to fail a sample than an operator randomly selected from the larger group. Which group most closely reflects the opinion of our customers? How much faith can be put in the pro- fessionals' power of discrimination when all six would have failed one of the standards and three of them both standards? Does this mean that the company is wasting money by re-working acceptable batches of powder? These are interesting questions with no clear-cut answers, but one thing which seems to emerge from this and similar experiments is that human colour matehers are every bit as human as the rest of us. They have doubts, they have off-days and they do their job as conscientiously as possible. Tristimulus colour measurements can help by putting an objectively deter- mined number (or numbers) on a subjectively evaluated quality, thus allow- ing the subjective quality to be treated in the same manner as some physical characteristic such as length or weight. Fig. 8(a)-8(c) illustrate the use of colour difference graphs in which differences between the co-ordinates relating to the standard and sample are plotted against each other. In Fig. 8(a), for example, the difference between 'a' values, Aa (sample minus standard) are plotted against the difference between 'b' values, Ab (sample minus standard) for a number of accepted batches of a light-coloured face powder. The actual co-ordinates of the standard material were L = 74.0, a-- + 8.4, b = + 12.7 but its position on the Aa/Ab diagram is at point 0,0 in the very centre of the graph. Any marked position above the Ab -- 0 line represents a batch which was accepted more yellow (or less blue) than standard and any below the line was passed less yellow (or more blue) than standard. Similarly, any point to the right of the Aa--0 line marks the position of a batch accepted more red, or less green, than standard and any to the left of the line were less red or more green than the standard. The further from the centre the position of a sample, the further away from the standard colour it is. It would be convenient if a circular 'acceptance zone' of fixed radius could be drawn around the centre so that any sample with co-ordinates falling within the circle could be passed. Unfortunately, however, the data illustrated in Fig. 8(a) do not justify it since there is only one point situated in the upper left quadrant. Fig. 8(b) and 8(c) (showing AL/Aa, AL/Ab respectively) provide even less justification for such a symmetrical simplification. It is evident that the spread of points along the zkL axis is much greater than along the other two. It is tempting to speculate that because L, a, b, colour space is not perfect and the three-colour scales are only approximately equivalent in

(a) Ab -2 Showing the positions of accepted botches of a light coloured face powder L,o,b readings of the standard L:T4.0, e=+84, b:+12 T -I ø o o oo o o o Mean Standard deviation -0 16 0-50 +0 02 0.32 -014 0 $5 oo o o (b) AL -2 I o o e o o o o o o o o o (c) &L -2 o o o o o oo -J o øøo o o o Ab o o o -I o Figure 8. Colour difference graph (a) (Aa/Ab) (b) (AL/Aa) (c) (AL/Ab).
Purchased for the exclusive use of nofirst nolast (unknown)
From: SCC Media Library & Resource Center (library.scconline.org)